
Sales forecasting techniques: 5 forecasting models that improve forecast accuracy

Table of Contents:
Sales forecasting techniques determine how accurately revenue teams predict pipeline outcomes.
Most sales organizations run forecasts through CRM data and pipeline stage reviews, yet forecast misses remain common. Data quality drives forecast reliability. When CRM activity is inconsistent and customer engagement stays disconnected from opportunity records, any forecasting method produces unreliable output.
This article covers five forecasting techniques B2B sales teams use, why forecasts break down , and what teams can do to improve forecast accuracy.
Key takeaways
- Sales forecasting techniques only produce accurate outputs when the underlying pipeline data is current and consistent.
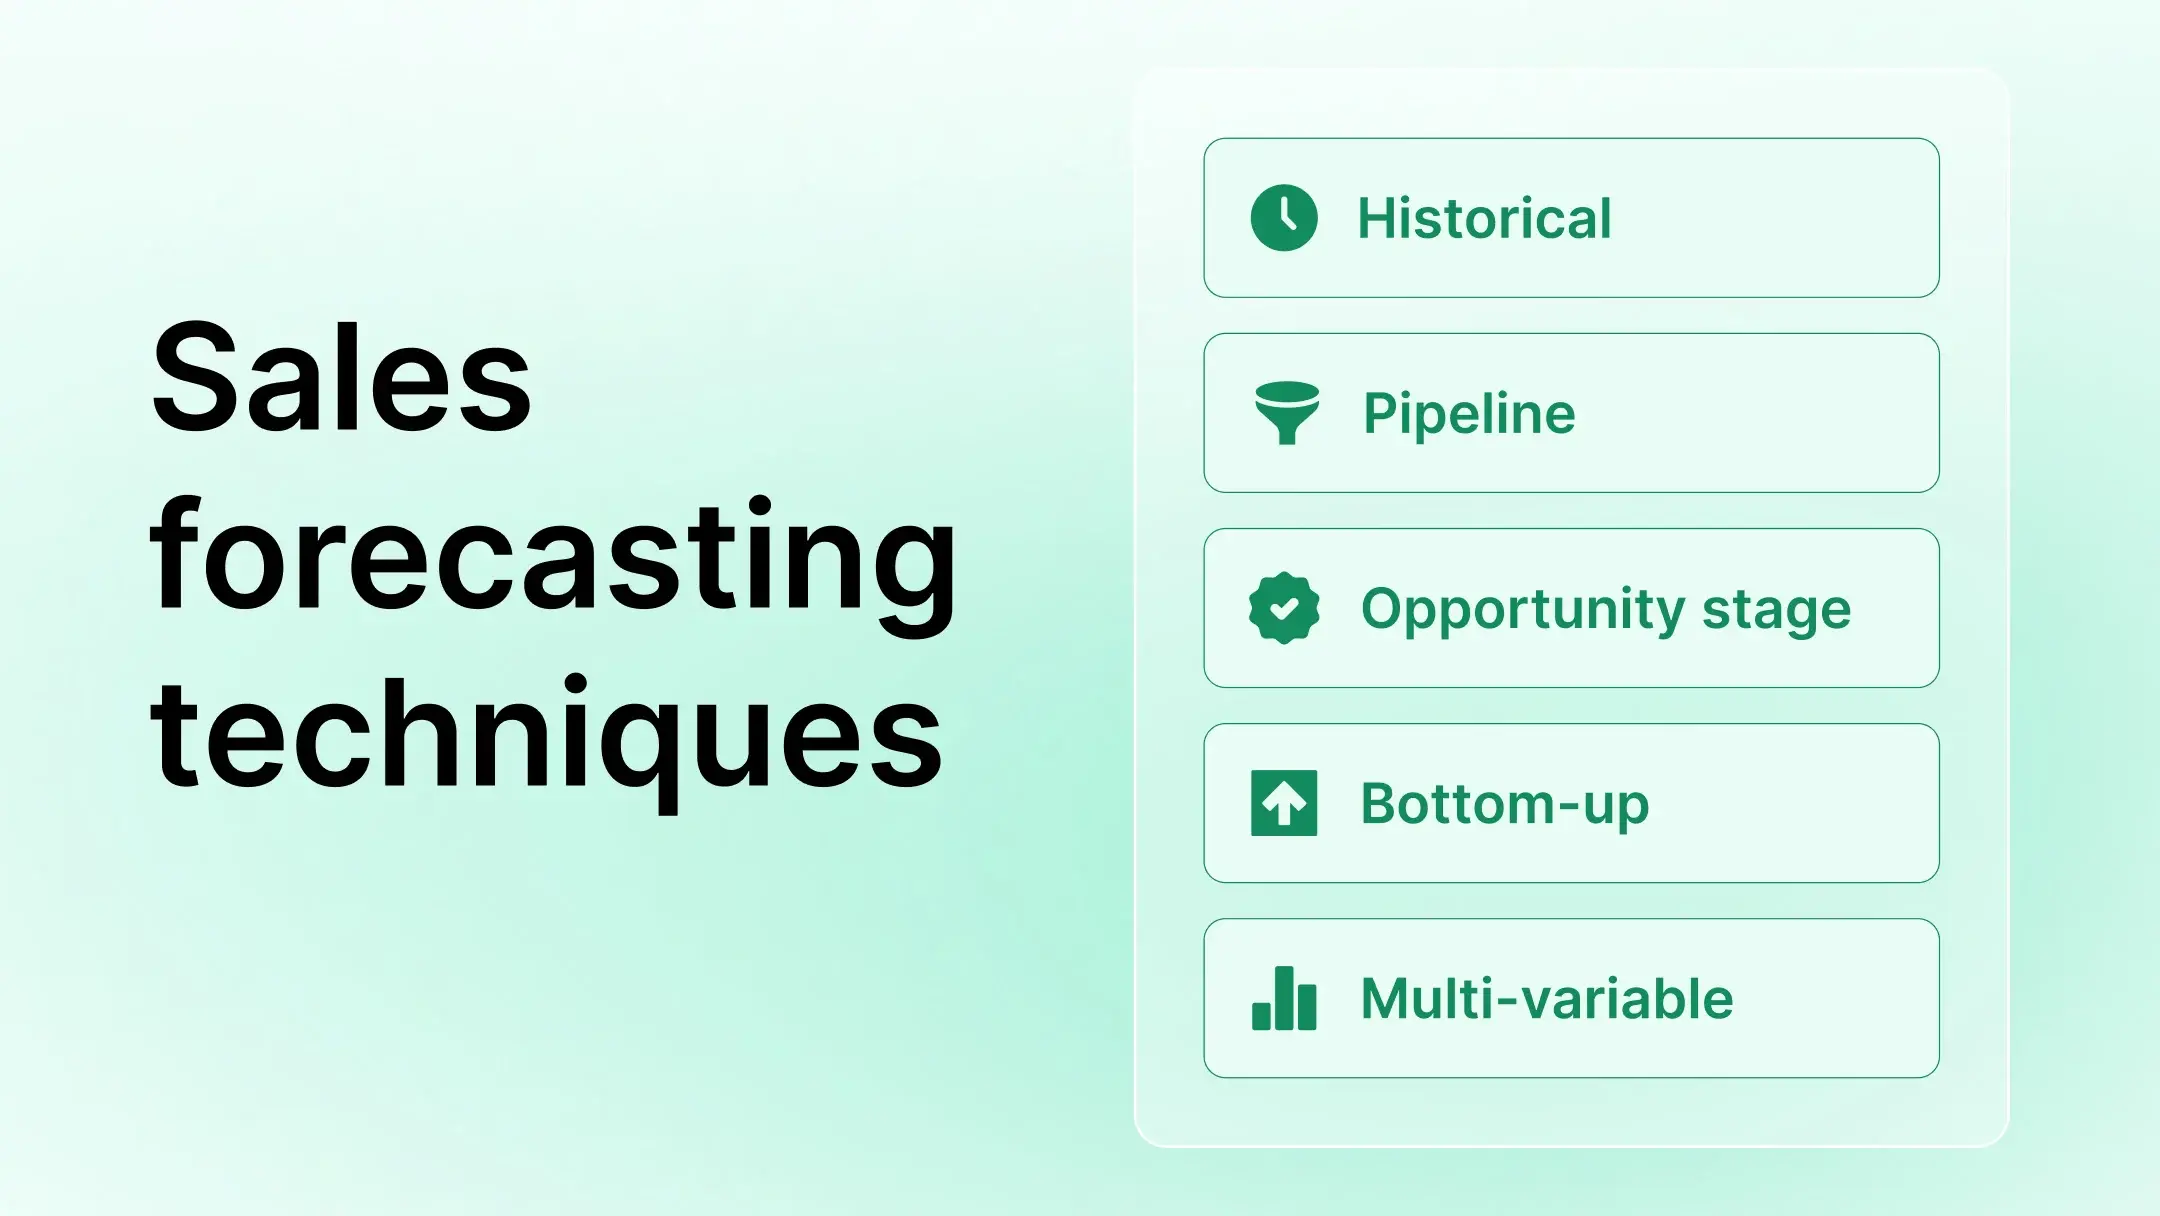
- Historical, pipeline, opportunity stage, bottom-up, and multi-variable forecasting each serve different use cases with specific tradeoffs.
- CRM hygiene directly affects forecast reliability. Stale opportunities and inconsistent stage updates create inaccurate revenue projections.
- Customer conversations reveal deal risk earlier than CRM fields alone. Meeting intelligence adds context that spreadsheet-based forecasting misses.
- Teams that connect pipeline activity, customer engagement, and CRM data in one workflow build forecasts that reflect deal reality. Avoma connects all three in one platform.
5 sales forecasting techniques and when to use them
Sales teams use different forecasting models based on their sales cycle, data quality, and organizational structure. These are the five sales forecasting techniques B2B sales organizations use most, along with when they work and where they fall short.
1. Historical forecasting
Historical forecasting uses past sales data to estimate future revenue. Teams look at previous quarter performance, seasonal trends, and year-over-year patterns to build a baseline projection.
This method works well in stable sales environments with consistent deal volume and predictable seasonal patterns. If a company closes a similar ARR figure across the same period in consecutive years, that pattern gives a reasonable starting point for the next forecast cycle.
Historical forecasting struggles when market conditions shift, when a company enters a new segment, or when the sales team grows significantly. Past performance does not account for changes in pipeline composition or new competitive pressures, so teams that rely on historical data alone miss live signals about what is happening in their current pipeline.
2. Pipeline forecasting
Pipeline forecasting uses active deal data to project revenue. Teams calculate a forecast based on the total value of open opportunities, adjusted for pipeline stage and expected close dates.
The reliability of this method depends on CRM data quality. When reps update deal stages, opportunity values, and close dates after customer interactions, pipeline forecasting gives managers a clear picture of where revenue is likely to land.
When a deal that stopped progressing three weeks ago still shows as active in the CRM, it inflates the forecast. Managers who base decisions on that number carry a risk they cannot see.
3. Opportunity stage forecasting
Opportunity stage forecasting assigns a probability percentage to each pipeline stage and calculates a weighted forecast from those values. A deal in discovery might carry a 20% probability, while a deal in contract review might carry an 80% probability.
Sales organizations use this method to build more nuanced revenue projections than raw pipeline totals provide. When stage probabilities reflect historical win rates, the weighted forecast gives a realistic view of expected revenue.
Reps who advance deals in the CRM before the customer has progressed create an optimistic forecast. Managers reviewing stage-weighted data without deal-level context cannot identify those gaps from the forecast number alone.
4. Bottom-up forecasting
Bottom-up forecasting builds revenue projections from rep-level deal data. Reps commit deals they expect to close, managers review and adjust those commitments, and leadership rolls up a final number.
This method provides greater pipeline visibility than top-down approaches because it requires deal-level review at every layer. When managers inspect deals during the forecast process, they surface risks that would otherwise stay invisible until close.
Reps skew optimistic, and manager judgment varies across teams. Without structured deal inspection criteria, bottom-up forecasting reflects rep confidence more than deal reality.
5. Multi-variable forecasting
Multi-variable forecasting combines multiple data signals to build a projection. Teams use CRM activity, pipeline movement, customer engagement, historical win rates, and deal-specific context together, reducing the risk that a single data gap will distort the output.
Companies implementing multi-variable forecasting often start with manual processes, combining pipeline data with call activity and email engagement. More mature organizations move toward AI forecasting that weigh these signals across CRM activity, call data, and engagement history.
A multi-variable model built on inconsistent CRM data still produces inconsistent output. Operational visibility is what makes the model useful.
Why sales forecasting techniques become inaccurate
Teams use forecasting tools and models but feed them with inconsistent data, and the output reflects that inconsistency.
CRM data is the most frequent source of inaccuracy. When reps update the CRM less often than deals move, pipeline stage data drifts from reality. Managers reviewing stale records make decisions based on what the CRM shows, not what is happening with the customer.
Without structured pipeline reviews, deals stay open long after customer interest has dropped. Reps keep opportunities alive in the forecast because there is no process that requires removing them.
Customer engagement signals add context that CRM fields cannot capture on their own. A deal that looks healthy on paper, with the right stage and a close date two weeks out, may have gone quiet in actual customer conversations. That silence does not appear in CRM records unless a rep enters the update.
When reps submit forecast updates through Excel spreadsheets or weekly check-ins, the data reflects the last submission. Deal conditions that changed in between stay invisible until the deal closes or falls out.
What improves forecast accuracy?
Forecast accuracy improves when the data fed into the model reflects current deal status. Teams that invest in CRM discipline and pipeline visibility see greater improvement than teams that switch forecasting models.
Reps should update deal stages, opportunity values, and close dates after customer interactions. When CRM data reflects current deal status, any forecasting technique produces more reliable output. Salesforce's State of Data and Analytics found that 74% of sales teams with AI prioritize data hygiene as a growth driver, a sign that clean pipeline records have moved from a back-office task to a revenue strategy priority.
Structured pipeline management helps managers identify deals that are stalling, advancing, or at risk before close date assumptions become problems. Regular deal reviews with defined criteria are what make pipeline data useful, not just current.
Knowing whether a champion has gone quiet, whether new stakeholders have joined, or whether the customer's timeline has shifted gives managers context that changes how they assess forecast risk. Customer engagement visibility fills the gaps that CRM hygiene alone cannot.
Why customer conversations matter in forecasting
Customer conversations carry deal information that CRM fields do not capture. When a champion stops responding, when a decision maker raises a new concern, or when the buying committee expands, those signals appear in conversations before they show up anywhere else.
A deal sitting in "Proposal Sent" for three weeks looks the same on paper whether the customer is actively evaluating or has moved on. Teams that review only pipeline stage data cannot tell the difference.
Conversation intelligence changes what managers can see during pipeline reviews. When conversation data connects to deal records, managers can review what was discussed, which stakeholders participated, and the questions the customer raised. That context informs forecast risk assessments in ways that stage labels cannot.
Stakeholder engagement patterns also reveal forecast risk. When a buyer who was active in early calls stops attending, that change is visible in meeting activity data. When a new executive joins a call late in the deal, that signals either a positive escalation or a concern that needs attention before close.
How Avoma improves sales forecast accuracy
Avoma closes the gap between what reps submit and what is happening in live deals, using conversation signals, deal health scores, and a submission workflow that managers can validate before rolling up a number.
Forecast submissions backed by deal health, not estimates
When reps submit forecasts in Avoma, they commit specific deals from their pipeline, each scored by Deal Health Alerts generated from conversation and email signals. Managers reviewing team submissions see Risk Scores, Qualification Scores, and weighted pipeline amounts at the deal level. Submission history shows how Commit and Best Case numbers shifted week over week, so managers know where confidence is moving before the final roll-up.
A forecasting dashboard managers can act on
The forecast submission dashboard tracks revenue targets, attainment, pipeline coverage, and deal-level context across multiple pipelines for both sales and customer success teams. Revenue intelligence surfaces which deals need attention, which are at risk, and what the gap is between what is committed and what is likely to close.
Final thoughts
Sales forecasting techniques fail when the data feeding them does not reflect what is happening in live deals. CRM consistency, structured pipeline inspection, and visibility into customer engagement are what make forecasting reliable. Teams that connect conversation activity to pipeline data build forecasts that reflect deal reality.
Start a free trial of Avoma to see how conversation intelligence connects to your forecasting workflow.
Frequently Asked Questions
No single technique is the most accurate for all teams. Multi-variable forecasting tends to produce the most reliable results because it combines multiple signals, including pipeline data, customer engagement, and historical win rates. Accuracy depends more on the quality of underlying CRM data and deal inspection discipline than on the technique itself.
Sales forecasts become inaccurate when CRM data is stale, when deal stages do not reflect actual customer progress, and when pipeline reviews lack the deal-level context needed to identify risk. Rep optimism bias also contributes. Reps keep deals open longer than deal activity justifies, which inflates the pipeline and the forecast.
Sales forecasting models use historical sales data, pipeline stage and deal value, opportunity close dates, rep forecasting commitments, and customer engagement signals. More advanced forecasting systems also incorporate call activity data, stakeholder engagement patterns, and machine learning models trained on historical win-loss patterns.
Avoma improves forecasting by syncing call notes, action items, and meeting activity to the CRM after customer interactions, so deal records stay current without manual rep entry. During pipeline reviews, managers access conversation summaries and stakeholder engagement data alongside deal stage and opportunity value. This gives forecast reviews deal-level context that CRM fields alone do not capture.


What's stopping you from turning every conversation into actionable insights?


