
How RevOps teams use predictive sales analytics across the revenue lifecycle

Table of Contents:
There are a few moments that push RevOps teams toward predictive sales analytics. A forecast that looked clean falls apart in the last 2 weeks of the quarter. A high-value deal slips out of pipeline with no warning signs in the CRM. A new revenue leader joins and immediately questions why the team can't say which deals are actually at risk.
All 3 are visibility problems, and predictive sales analytics is what closes that gap.
This article covers how RevOps teams use it across the full revenue lifecycle including lead scoring, deal risk detection, forecasting, expansion prediction, rep performance analysis, and territory planning. And what you need in place before any of it works.
TL;DR
- Predictive sales analytics goes beyond forecasting. RevOps teams use it for lead scoring, deal risk detection, rep performance analysis, expansion prediction, and territory planning.
- It works best on top of clean CRM data, consistent pipeline stages, and forecast accountability. Without those foundations, the model inherits your operational problems.
- Most implementations fail because of poor adoption, not poor technology. Workflow integration and change management matter as much as the platform itself.
- Vendors that say "AI-powered" don't always mean predictive. Know where in the revenue lifecycle a platform's predictions are actually reliable before you buy.
- Avoma helps RevOps teams with the operational prerequisites: CRM hygiene, forecast accountability, and consolidated revenue data.
What predictive sales analytics actually means
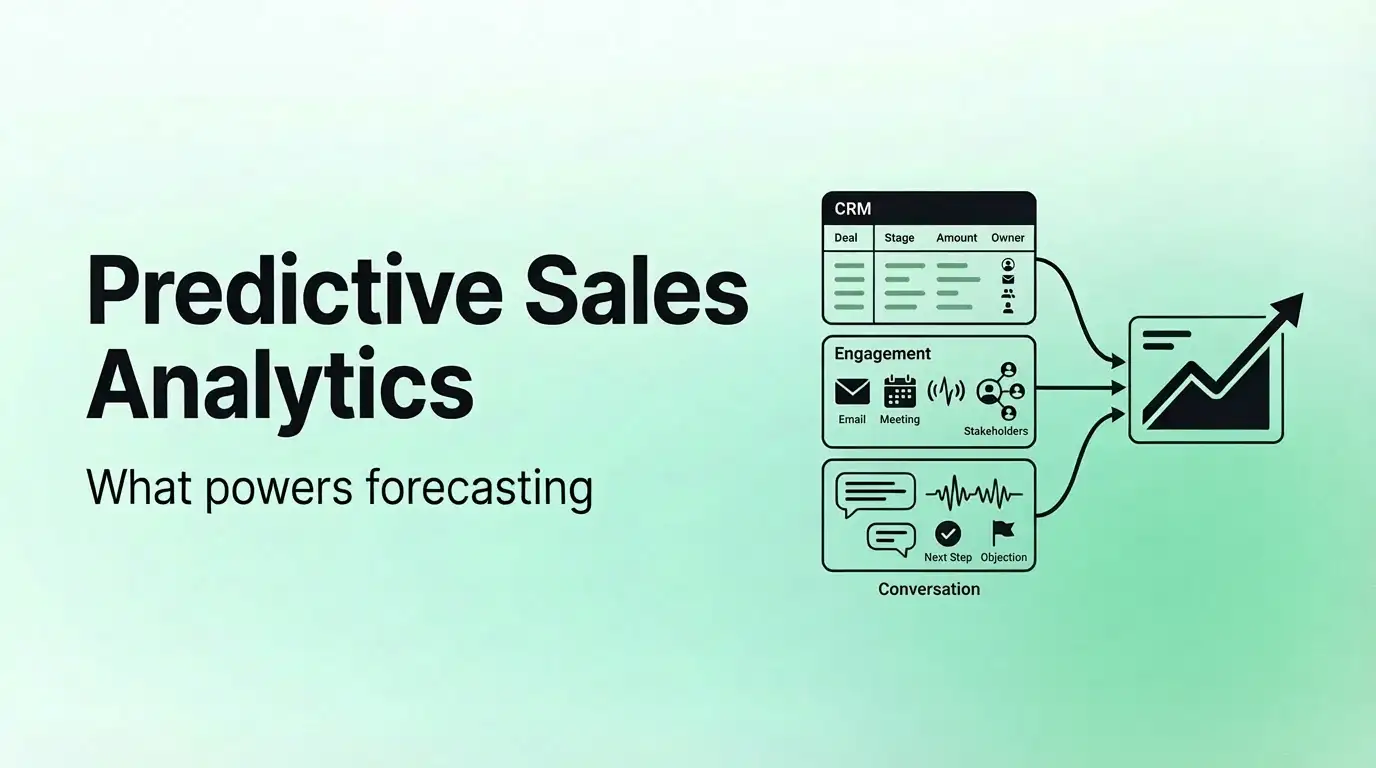
Predictive sales analytics is the use of machine learning and historical data to forecast future revenue outcomes, score deal and lead risk, and surface signals that help revenue teams act before problems become visible in a pipeline report.
The difference between reporting and prediction
Most sales analytics tools explain what already happened. Win rate last quarter. Average deal cycle. Close rate by rep. Useful context, but it won't help you make a decision about a deal that's moving too slowly right now.
Predictive sales analytics estimates what's likely to happen next, using historical patterns and behavioral signals to score current deals, rank leads, and project revenue outcomes. The output is probability-weighted.
Common applications: deal risk scoring, lead conversion probability, forecast confidence levels, churn prediction, expansion likelihood. Each uses pattern recognition across past behavior to surface a signal before the outcome arrives.
Why predictive analytics became a RevOps priority
Pipelines got larger and more complex. Boards started demanding forecast predictability, not just revenue growth. GTM systems multiplied, making unified visibility harder. And AI adoption pressure created urgency to do something with all the data companies were already sitting on.
RevOps analytics moved from nice-to-have to operational requirement when leadership stopped trusting gut-based forecasts.
Predictive analytics vs. revenue intelligence vs. forecasting tools
These three terms get used interchangeably. They mean different things.
There's real overlap. Avoma sits at the intersection of revenue intelligence and predictive sales analytics, surfacing deal risk signals from conversation data and CRM activity, then feeding those signals into forecasting and pipeline inspection workflows. That integration is where the operational value actually lives.
The categories are still distinct. Forecasting software gives you a number. Revenue intelligence shows you what's actually happening in deals. Predictive sales analytics software tells you what's likely to happen next and why.
How RevOps teams use predictive sales analytics across the revenue lifecycle
1. Predictive lead scoring
Predictive lead scoring ranks inbound and outbound opportunities by their likelihood to convert, using historical patterns across firmographic fit, behavioral signals, and engagement data. The goal: direct SDR effort toward leads that are most likely to progress, away from ones that look qualified but statistically don't convert.
The nuance most vendors skip: lead scoring only works when qualification standards are consistent. If different reps qualify leads differently, the model trains on inconsistent labels and produces inconsistent output. The same problem shows up in predictive pipeline analytics more broadly. Predictive CRM analytics systems learn from historical data, and when that data is stale or inconsistently structured across regions or segments, the predictions inherit every data quality problem baked into it. Cleaning up qualification criteria and CRM discipline are usually preconditions, not afterthoughts.
2. Opportunity and deal risk detection
Deal risk detection identifies stalled or deteriorating opportunities before reps surface them in forecast calls. By the time a rep flags a deal as at risk, the warning signs have typically been sitting in the data for 2 or 3 weeks. At that point, re-engagement is harder, competitive alternatives have had time to take hold, and decision-maker access has narrowed.
Predictive sales analytics pulls those signals forward. Risk indicators typically include declining email or call engagement, unusual gaps in deal velocity, abnormal sales-cycle length relative to segment benchmarks, absence of multi-stakeholder involvement in late-stage deals, and lack of committed next steps.
Platforms like Avoma combine CRM activity, buyer engagement signals, and conversation intelligence to surface stalled deals earlier. Because Avoma captures what actually happens on calls (objections raised, decision-makers identified, buyer sentiment), the risk signals reflect conversation reality rather than rep-reported status.
Clari, InsightSquared approach deal risk from the forecasting layer, using pipeline data and submission patterns to flag variance. Gong and Avoma approach it from the conversation layer, using interaction patterns to surface engagement deterioration. Both catch different types of risk and work better in combination.
3. Forecast accuracy and pipeline confidence
AI sales forecasting has moved beyond simple weighted pipeline. Modern predictive revenue analytics platforms apply machine learning to historical close patterns, deal velocity, rep submission behavior, and engagement signals to produce probability-adjusted forecasts.
The output is a confidence score, a variance range, and a breakdown of which deals are driving forecast risk. Revenue forecasting analytics at this level lets RevOps leaders run commit-risk analysis before a forecast call, not during it.
Salesforce has built predictive forecasting into its Einstein layer. HubSpot offers AI-assisted forecasting for mid-market teams. Clari has built their platforms around forecasting as the primary use case, each with a different approach to confidence scoring and model explainability.
Worth being honest about the timeline: accuracy improves as models learn from more complete, consistent data. Teams expecting quarter-one improvements typically see quarter-three or quarter-four results, if they stay patient enough to get there.
4. Customer expansion and renewal prediction
For SaaS and recurring revenue teams, predictive sales analytics extends well past the new-business pipeline. Churn prediction, upsell timing, account expansion likelihood, and renewal forecasting all use the same pattern-recognition approach applied to post-sale customer behavior.
The signals are different. Instead of deal velocity and engagement patterns, the model watches product usage trends, support ticket frequency, NPS trends, and customer conversation patterns. An account that stops showing up to QBRs and quietly reduces product usage is a churn risk months before the renewal conversation.
This is where revenue intelligence and AI sales analytics overlap most clearly with customer success operations. RevOps teams that own CS data alongside sales data get a more complete picture of revenue risk across the full customer lifecycle.
5. Sales activity optimization
Predictive sales analytics software surfaces outreach timing recommendations, engagement pattern analysis, next-best-action guidance, and correlations between specific activity types and deal outcomes. Which outreach sequences actually convert at your company? Which call duration correlates with late-stage progression? Which accounts are underinvested?
Sales AI analytics can answer those from historical patterns. The answers are specific to your data, which is why generic benchmarks often mislead. A rep who follows industry-average outreach cadence may be overinvesting in some segments and underinvesting in others relative to your actual conversion patterns.
6. Territory and capacity planning
Predictive analytics applied to territory design changes how RevOps teams approach quota-setting and headcount decisions. Instead of distributing accounts by volume or geography, territory models weight by predicted conversion likelihood, account expansion potential, and historical win rates by segment.
Pipeline coverage modeling gets more precise when you can predict close probability at the segment level rather than applying a flat coverage ratio across all deals. RevOps teams at scaling companies use this to inform Q3 hiring decisions in Q1, rather than reacting to pipeline shortfalls mid-year.
Microsoft Dynamics 365 and Salesforce both include capacity planning modules with predictive elements. Standalone RevOps analytics platforms like InsightSquared offer more granular territory modeling for teams that need it.
7. Rep performance pattern analysis
Predictive sales analytics works as behavioral intelligence when applied to rep-level data. Patterns like consistent overcommitting, irregular stage progression, pipeline inflation, and low activity-to-conversion ratios become visible across a large rep population in ways that manual review can't scale to.
For RevOps, this separates performance problems from data problems. A rep with a low close rate in a particular segment might be underperforming, or might be getting routed deals with a low historical win rate regardless of rep. Predictive CRM analytics can distinguish between the two.
Oracle and Salesforce surface rep-level predictive signals through their analytics layers. Avoma adds another dimension: rep behavior on calls, including methodology adherence, objection handling patterns, and whether reps are following coached behaviors. Pipeline data and conversation data together give a more complete picture of rep performance than either source alone.
What high-performing RevOps teams do before implementing predictive analytics
Before introducing forecasting models or predictive sales tools, high-performing RevOps teams first fix the operational foundations: standardized pipeline stages, reliable CRM data, clear forecast accountability, and connected revenue systems.
1. Standardize pipeline stages
AI can't compensate for inconsistent process definitions. When "Stage 3" means different things across segments, regions, or individual reps, the model trains on noise. Exit criteria need to be explicit, agreed upon, and enforced before predictive sales forecasting produces reliable output.
Getting a sales organization to agree on what "qualified" or "committed" means is more of a change management problem than a technical one. It requires leadership alignment and consistent enforcement, not software.
2. Improve CRM hygiene before buying AI tools
Most predictive analytics failures begin as CRM discipline failures. Mandatory fields that aren't actually mandatory. Activity tracking that captures some channels and misses others. Ownership rules that create gaps in the record. No AI layer resolves those.
The diagnostic question: if you pulled your last 12 months of closed-won and closed-lost data from Salesforce or HubSpot, could you identify the signals that predicted each outcome? If the data isn't clean enough to answer that retrospectively, a predictive model won't do much with it prospectively.
3. Build forecast accountability into sales management
Predictive revenue analytics requires that someone does something with the output. That means building pipeline inspection cadence into management routines, not just launching a dashboard. Managers who don't review deal risk alerts or push back on pipeline submissions that contradict model scores strip out the operational value that AI sales forecasting creates.
4. Consolidate fragmented revenue data
Predictive sales analytics platforms struggle when GTM data lives across disconnected systems: Salesforce for pipeline, HubSpot for marketing, a separate tool for conversation intelligence, another for customer success, and a spreadsheet for territory planning. Each layer adds friction and creates gaps that predictive models either fill with assumptions or flag as missing inputs.
Avoma addresses this by unifying scheduling, conversation data, CRM sync, and pipeline intelligence in one platform. When all the signals feed a single system, the predictive layer has cleaner data to work with.
Common predictive sales analytics mistakes
The biggest mistakes usually come from treating AI as a quick fix, underestimating adoption and change management, or expecting immediate forecasting improvements before the underlying sales process is mature enough to support accurate predictions.
1. Treating AI as a shortcut
Companies buy predictive sales analytics software hoping it will solve problems that are fundamentally operational. When the software arrives and the problems persist, the tool gets blamed. But the tool just made the dysfunction visible.
The most common version: a team with rep sandbagging and political forecasting cycles buys an AI sales forecasting platform expecting it to stabilize the number. What happens is the model surfaces the same submission inflation the managers were already seeing, and now there's a $200k software bill attached to the same conversation. When reps submit forecasts that reflect what they want to close, managers adjust upward under leadership pressure, and leadership adds another layer on top, the model has nothing reliable to learn from.
Predictive sales analytics amplifies operational maturity. Teams with clean data and consistent processes get a lot out of it. Teams without those foundations get a more expensive version of the same visibility problem.
2. Overfocusing on tool features instead of adoption
Dashboard obsession is a real pattern in RevOps analytics implementations. Teams evaluate platforms on model sophistication, UI quality, and feature breadth, then launch with high adoption intentions. Six months later, 3 managers use it regularly and the rest of the org has reverted to spreadsheets and gut calls.
Workflow integration creates adoption. Predictive sales analytics software that sits outside the tools reps and managers already use every day rarely sticks.
3. Ignoring change management
Rep resistance to AI recommendations is understandable. A model that scores a rep's deal at 12% confidence when the rep believes it's closing next week creates friction. Managers who override model scores in every forecast review signal to the org that the tool is advisory at best.
Effective change management for AI sales forecasting requires clear communication about how the model works, manager accountability for engaging with model output, and a feedback loop where reps can flag when scores feel wrong. Without that, adoption stalls.
4. Expecting immediate forecast accuracy improvements
Predictive sales analytics improves accuracy over time, through cleaner data, consistent process, and accumulated historical pattern learning. Implementations that expect quarter-one improvements typically see quarter-three or quarter-four results, if they stay patient enough to get there.
How to evaluate whether your organization is ready
Predictive sales analytics works best for organizations that already have disciplined sales operations in place. Teams with standardized processes, reliable CRM data, and strong RevOps governance are far more likely to see meaningful forecasting improvements, while teams still struggling with operational consistency usually need to fix foundational gaps before layering on AI-driven analytics.
Signs your team is ready
Your sales process has explicit exit criteria that reps actually follow. CRM adoption is consistent across the rep population. You have at least 12 months of historical deal data with reasonable completeness. RevOps owns the data governance process. Leadership trusts pipeline data enough to make decisions from it.
Signs you should fix operations first
CRM adoption is poor or uneven. Qualification criteria vary by manager or segment. Forecasting still runs primarily through spreadsheets. Leadership routinely overrides pipeline data. There's no defined pipeline inspection cadence.
A revenue operations maturity framework
Most organizations that struggle with predictive sales analytics implementations are trying to move from Reactive or Structured directly to Predictive, skipping the Operational stage entirely.
How RevOps leaders should evaluate predictive sales analytics platforms
Choosing a predictive sales analytics platform is less about flashy AI claims and more about operational fit, forecast reliability, and actionable insight quality. RevOps leaders need to evaluate how well a platform integrates with existing workflows, explains its predictions, and delivers measurable forecasting improvements over time
Core capabilities that actually matter
CRM integration depth. How completely does the platform sync bidirectionally with Salesforce, HubSpot, or Microsoft Dynamics 365? Gaps in integration create gaps in the predictive model.
Forecast reliability over time. How does the platform's forecast accuracy compare to manager submissions across multiple quarters? That's the test that matters, not demo accuracy on curated data.
Deal risk visibility. Are risk alerts actionable and specific, or vague? Can a manager click through from a risk flag to the underlying signals?
Pipeline inspection workflow. Does the platform fit into the cadence managers already use, or does it require a separate review process?
Model explainability. Can reps and managers understand why a deal got a particular score? Black-box scoring creates distrust. When people understand the drivers, they're far more likely to act on the output.
Questions RevOps teams should ask vendors
- How does the model handle incomplete CRM data? What happens to scores when key fields are missing?
- What behaviors and signals influence deal scoring? Can you show us exactly how a score is derived?
- What operational maturity is required before the platform delivers value? Any vendor that says "none" isn't being honest.
- How long does implementation realistically take before the forecast output is trustworthy? This is different from go-live time.
- How do you support change management and rep adoption? This is where most implementations fail, and most vendors have less here than they imply.
Why AI-powered doesn't always mean predictive
Many vendors use AI sales analytics positioning to describe reporting tools that surface historical data faster. Pattern recognition applied to historical data is useful, but it's a different thing from probability-weighted prediction about future outcomes. The distinction matters when you're evaluating what a platform will actually change.
6sense is genuinely predictive at the top-of-funnel level, using intent signals to predict buying likelihood before a lead enters your CRM. Clari is predictive at the revenue layer. Avoma is predictive at the deal and pipeline inspection level, using conversation signals and CRM activity together. Knowing where in the revenue lifecycle a platform's predictions are most reliable helps you match the tool to the problem you're actually trying to solve.
Conclusion
The RevOps teams that get the most from predictive sales analytics standardized their revenue processes first. They enforced CRM accountability, operationalized forecasting discipline, and built pipeline inspection into management routines before they bought any AI layer.
Get those foundations right, and predictive sales analytics does what it promises. Skip them, and you're paying a lot of money to see your operational problems reflected back at you in a dashboard.
Avoma helps RevOps teams improve CRM hygiene, build forecast accountability, and consolidate fragmented revenue data into one platform. See how Avoma works.
Frequently Asked Questions
Predictive sales analytics can improve forecast accuracy when the underlying CRM and pipeline data are consistent and complete. Most platforms use historical close rates, deal velocity, engagement activity, and rep behavior patterns to estimate likely outcomes. Accuracy usually improves over time as the model learns from larger datasets and cleaner operational processes. Teams with inconsistent pipeline stages or weak CRM adoption often see unreliable predictions because the model inherits those data quality issues.
Traditional sales forecasting typically relies on weighted pipeline stages and manager judgment to estimate revenue outcomes. Predictive sales analytics uses machine learning and behavioral signals to identify patterns associated with deal progression, forecast risk, and conversion likelihood. Instead of only reporting what has already happened, predictive analytics estimates what is likely to happen next and highlights the signals influencing those predictions.
Yes. Predictive sales analytics platforms monitor engagement trends, sales cycle velocity, stakeholder involvement, and CRM activity to detect warning signs earlier than manual pipeline reviews. A deal may appear healthy in a CRM while showing declining buyer engagement or stalled next steps in the underlying data. Platforms such as Avoma combine conversation intelligence with CRM signals to surface these risks before they become visible in forecast calls.
Most failures are tied to operational issues rather than model quality. Common problems include poor CRM hygiene, inconsistent qualification standards, weak manager adoption, and lack of forecast accountability. Teams sometimes expect AI to correct broken sales processes automatically, but predictive models depend on reliable historical data and consistent workflows. Low adoption is another major factor when managers and reps continue relying on spreadsheets or subjective forecasting methods.
Most predictive sales analytics platforms perform better with at least 12 months of reasonably complete historical sales data. The model needs enough examples of closed-won and closed-lost deals to identify meaningful patterns. Organizations with limited deal history or inconsistent CRM records may struggle to generate reliable predictions because the model lacks sufficient training data.
Predictive deal scoring commonly uses CRM activity, email engagement, call frequency, deal velocity, stakeholder participation, sales cycle length, and historical conversion patterns. Some platforms also analyze conversation intelligence signals such as objections, buying intent, next-step clarity, and decision-maker participation. Avoma, for example, combines conversation data with CRM activity to provide more context around deal health and forecast confidence.
Yes. Predictive sales analytics can extend beyond new business forecasting into churn prediction, renewal forecasting, and upsell identification. These models typically analyze product usage trends, support activity, customer engagement patterns, and account conversations to estimate expansion potential or renewal risk. This helps RevOps and customer success teams identify revenue risk earlier in the customer lifecycle.
Revenue intelligence platforms primarily focus on capturing and analyzing sales activity, conversations, and pipeline behavior. Predictive sales analytics platforms use those signals to estimate future outcomes such as forecast accuracy, deal risk, and conversion likelihood. The categories overlap in practice because many modern platforms combine revenue intelligence with predictive scoring capabilities. Avoma operates across both areas by connecting conversation insights with forecasting and pipeline inspection workflows.
Predictive sales analytics can help identify rep-level performance patterns that are difficult to detect manually. Examples include stage progression inconsistencies, low activity-to-conversion ratios, pipeline inflation, or segment-specific weaknesses. These insights can support coaching, territory adjustments, and process improvements. However, the system is most effective when managers actively review and operationalize the insights rather than treating them as passive reporting metrics.
RevOps teams should evaluate CRM integration quality, model explainability, workflow compatibility, forecast reliability, and implementation requirements. It is important to understand how the platform handles incomplete data, which signals influence scoring, and how long it typically takes for forecasts to stabilize. Teams should also assess whether their sales processes and CRM discipline are mature enough to support predictive modeling before investing in advanced AI capabilities.


Dive into Our Latest
Avoma Insights.


What's stopping you from turning every conversation into actionable insights?


