
Replace optimistic spreadsheets with forecasts built on pipeline signals
Avoma's sales forecasting software connects CRM data and conversation signals into a single pipeline view. Track pipeline movement, surface deal risk early, and submit forecasts grounded in deal data


Why your sales forecasts are unreliable

CRM data goes stale between reviews
No visibility into pipeline movement
Forecasts built on rep confidence
No consistent way to define commit
Forecast with accuracy, evidence, and control
Flag at-risk deals before they go cold
Deal health scores built from conversation signals, CRM activity, and buyer engagement identify which opportunities lack momentum. AI-generated Risk Scores, Qualification Scores, and Forecast Risks show at the deal level inside the submission table, so reps make more defensible commit decisions and managers catch underqualified deals before they reach the final number.
- Risk Score is driven by conversation intelligence signals from calls, emails, and meeting notes
- Qualification Score reflects deal criteria including executive sponsor coverage, next steps, and stakeholder involvement
The Pipeline Walk compares your pipeline at the start and end of a period, showing historical and current deal values side by side. A color-coded Pipeline Trend chart shows deal distribution and total value across stages so pipeline reviews start with data.
- Period-over-period comparison shows which deals advanced, regressed, or were lost
- Drill into any stage to see deal counts, values, and movement at the opportunity level
- Overlay forecast submissions on the Pipeline Trend chart to compare pipeline against what was committed
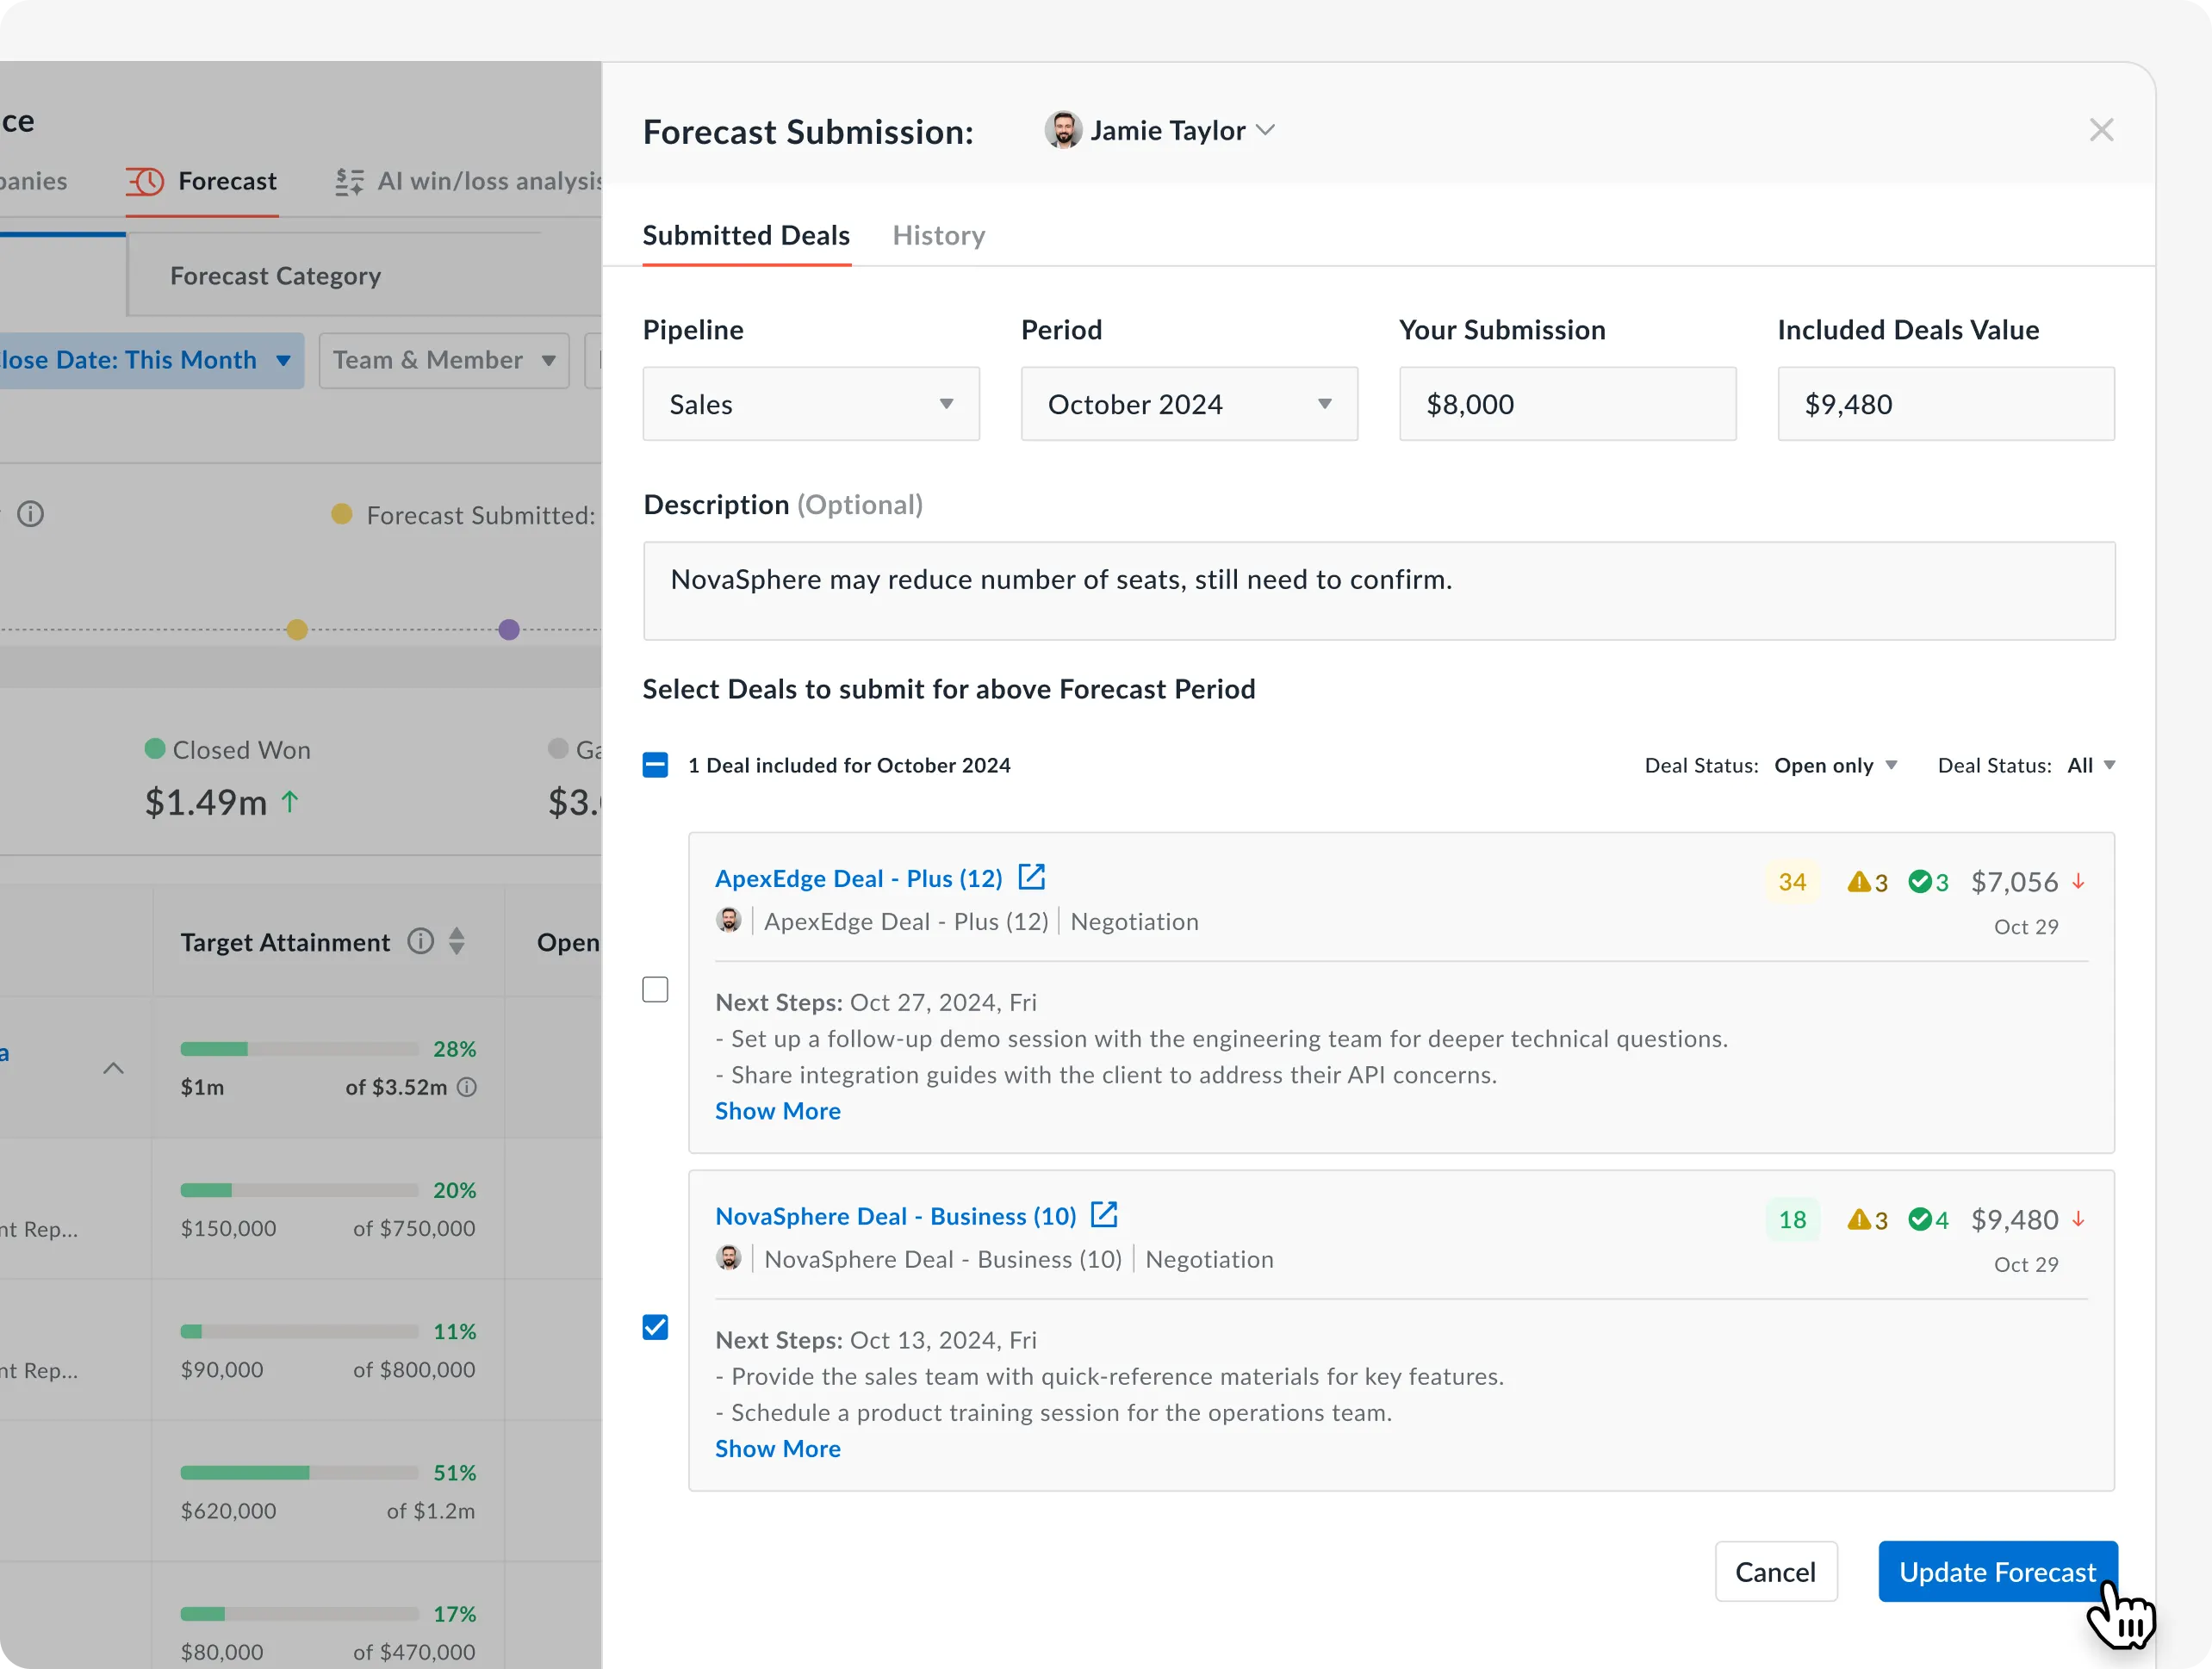
Track what was committed, changed, and by whom
The Forecast Overview consolidates key pipeline metrics including, target, closed won, commit, open deals, and others, directly into the submission screen. A guided workflow walks reps through Commit, Best Case, Pipeline, and Not Forecasted with per-category deal counts.
- Weighted Amount metrics calculate totals based on deal-stage probability, separating likely closes from raw pipeline value
- Submission history logs who changed what and when, with prior week comparisons showing how Commit and Best Case numbers shifted
- Forecast reminders go out by email or Slack on a recurring schedule, in each person's local timezone, to keep submissions consistent
.webp)
Track quota attainment against pipeline
The Target and Pipeline Overview shows percentage of quota attainment alongside open pipeline and gap coverage. Targets are set at team level, member level, or both, with roll-up computed when a team-level target is not explicitly set.
- Set targets by team, by member, or both in the same flow
- Attainment percentage updates as deals close and pipeline shifts
- Gap and coverage metrics drop away when quota is reached
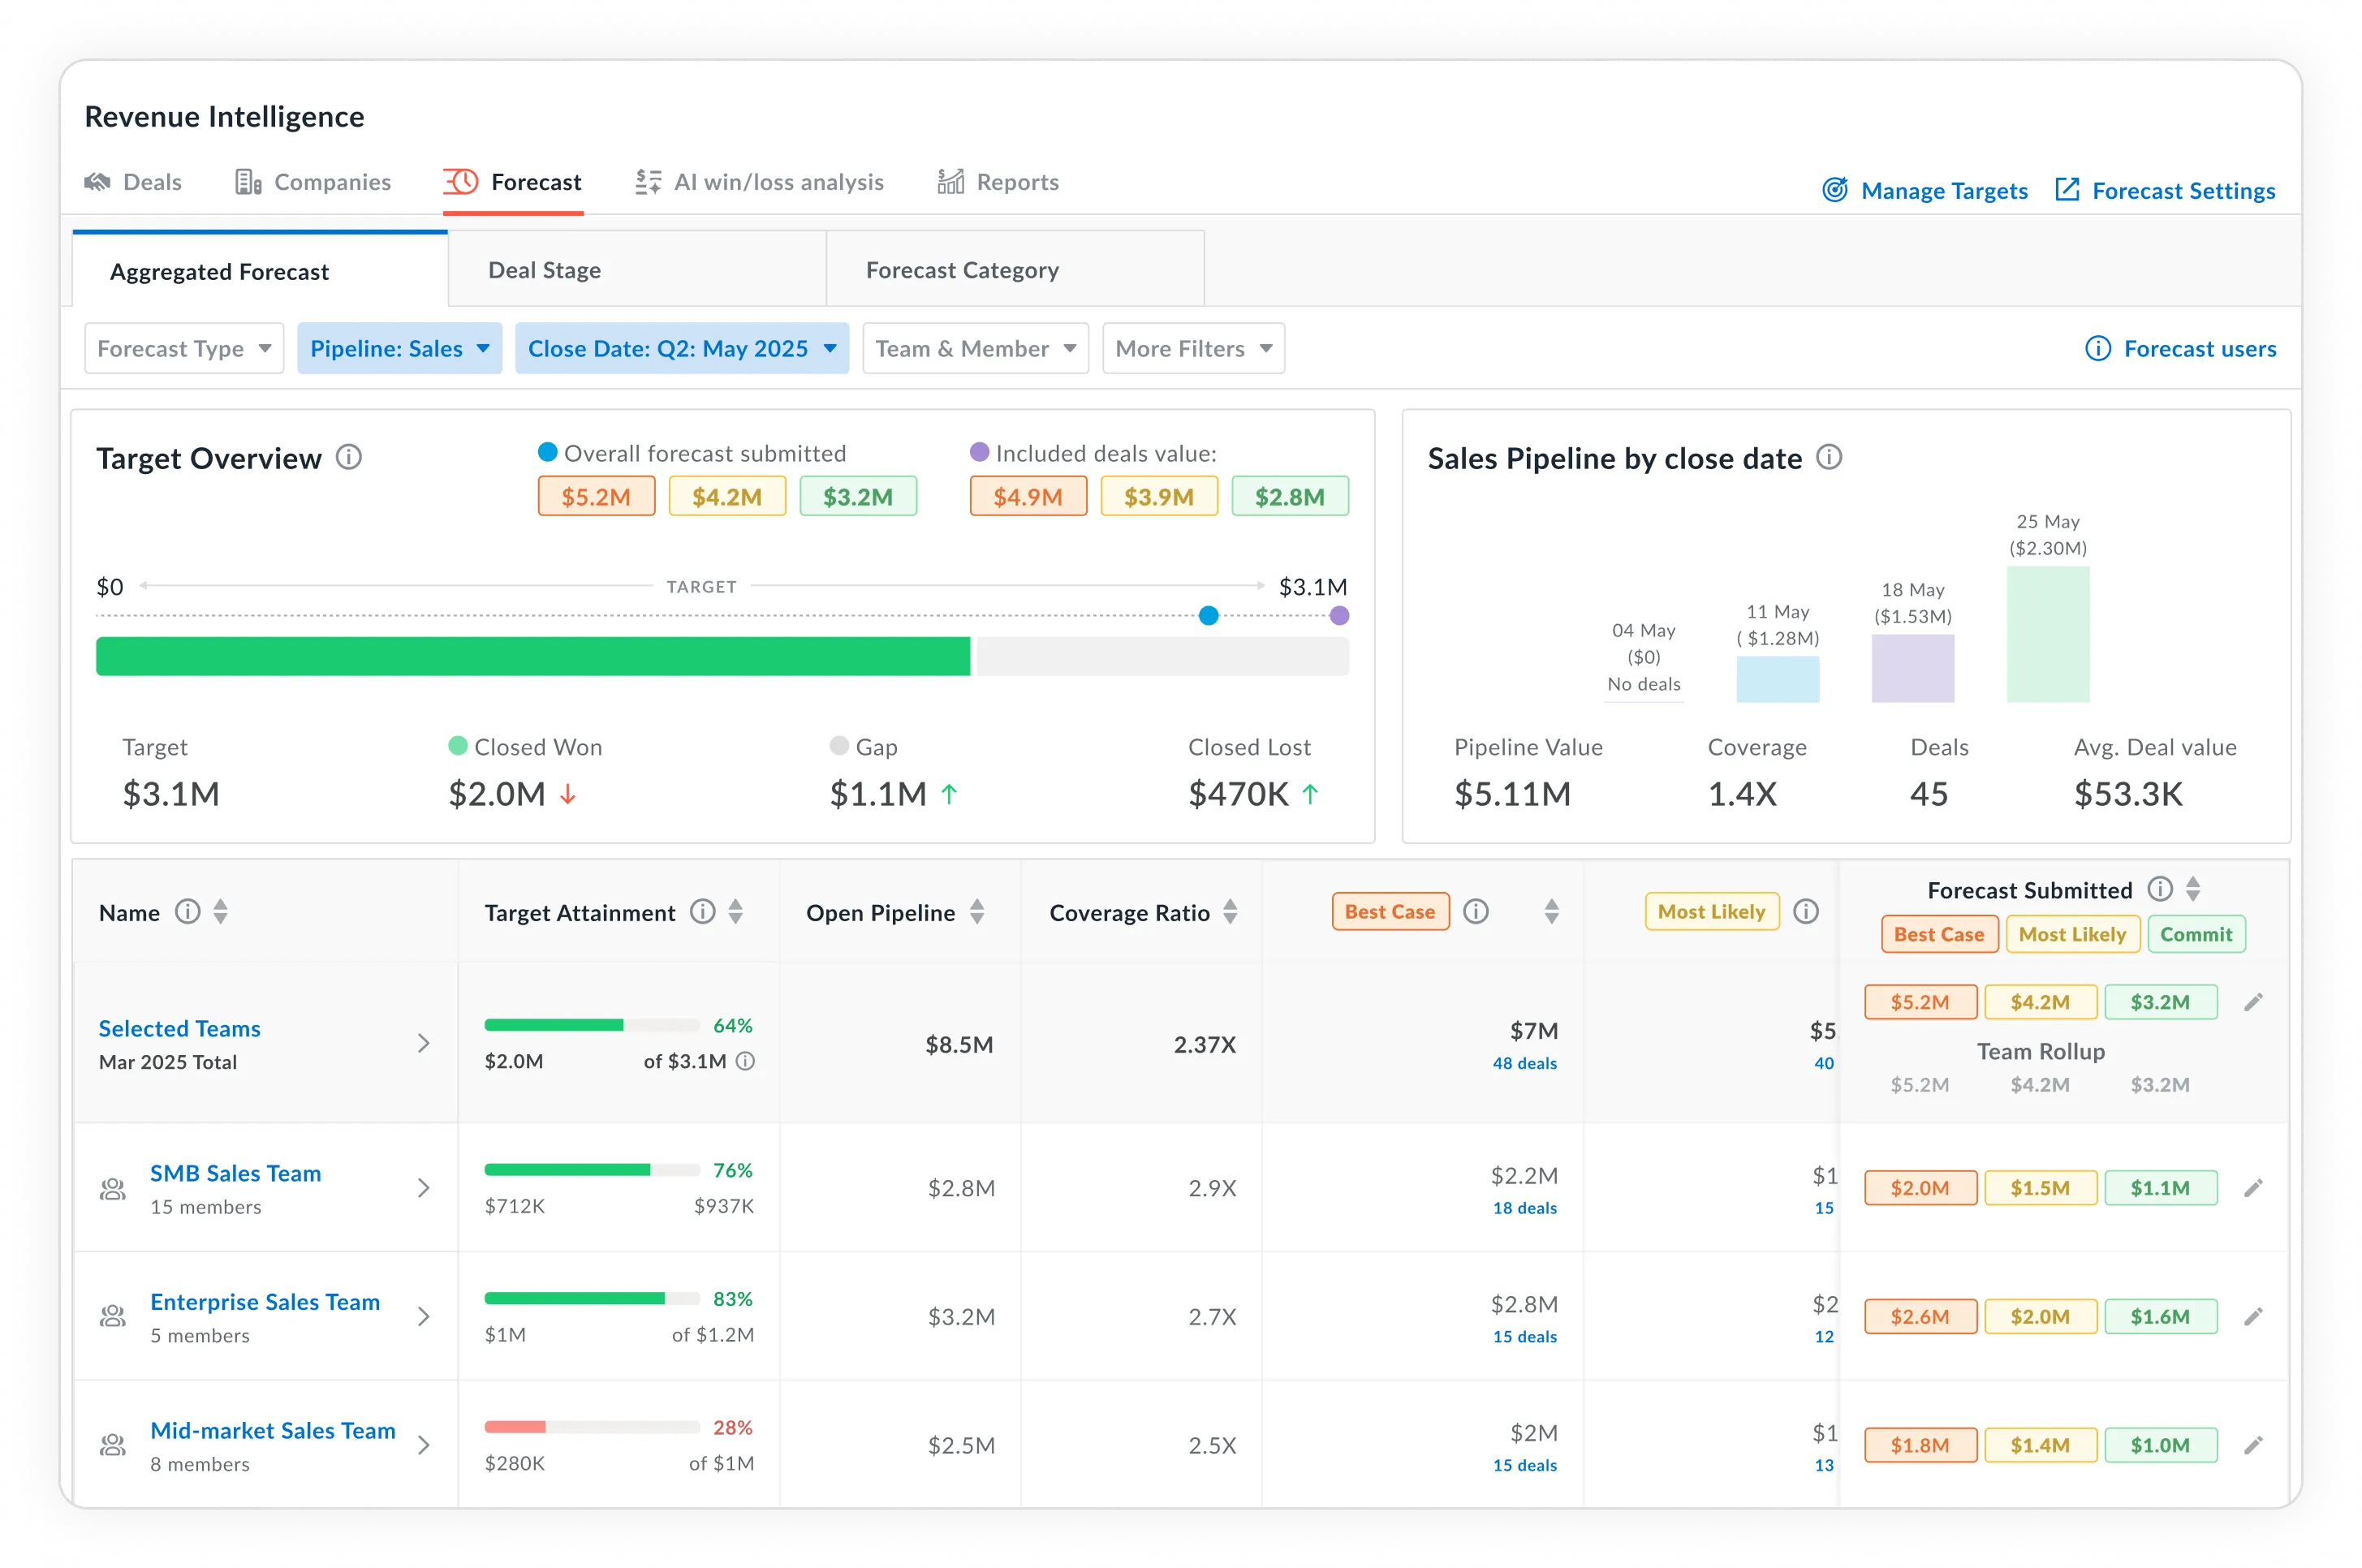
Give leadership a forecast built on deal data
Pipeline, Best Case, Commit, and Closed Won categories roll up by rep and manager into a structured revenue forecasting view. Custom forecast categories map to any CRM property so definitions reflect how your business operates across segments and product lines.
- Custom forecast categories ensure Commit, Best Case, and Pipeline mean the same thing across the team before rolling up
- Custom amount fields per segment support revenue prediction for multi-product teams
- Managers drill into selected deals to validate Commit with deal-level evidence before the number reaches leadership
3 minutes
6+
1 in 2
How Avoma turns pipeline data into a forecast you can defend
Link Avoma to Salesforce or HubSpot. Deal data, stage history, close dates, and custom fields sync across so the forecast dashboard reflects current pipeline status from day one.
After meetings, Avoma writes notes, next steps, and activity back to your CRM and scores the deal against conversation signals and buyer engagement. At-risk opportunities are flagged before they show up as misses in the forecast.
Managers check the forecast dashboard to review pipeline health, validate rep commits against deal evidence, and roll up to leadership. This is where revenue intelligence connects conversation data to pipeline reality, giving a forecast built on what is happening in deals, not what reps reported.
Trusted by high-performing revenue teams forecasting with confidence
Frequently asked questions

What's stopping you from turning every conversation into actionable insights?

Get started today.
<script type="application/ld+json">
{
  "@context": "https://schema.org",
  "@type": "FAQPage",
  "mainEntity": [
    {
      "@type": "Question",
      "name": "What is sales forecasting software and how does it work?",
      "acceptedAnswer": {
        "@type": "Answer",
        "text": "Sales forecasting software predicts future revenue by analyzing pipeline data, deal activity, conversation signals, and historical close rates. Avoma combines CRM data with conversation intelligence from calls and meetings to score deal health, track pipeline movement, and structure forecast submissions by rep and manager. This gives revenue leaders a forecast grounded in what is happening in deals, not what reps report."
      }
    },
    {
      "@type": "Question",
      "name": "How does Avoma's sales forecasting software differ from CRM-based forecasting?",
      "acceptedAnswer": {
        "@type": "Answer",
        "text": "CRM-based forecasting relies on rep-entered data, which is only as accurate as rep discipline allows. Avoma's sales forecasting software adds a conversation intelligence layer, analyzing calls, meetings, and emails to surface deal signals that never make it into the CRM. This means deal health scores, risk flags, and commit validation are based on buyer behavior, not manual updates."
      }
    },
    {
      "@type": "Question",
      "name": "Can sales forecasting software identify deal risk before a rep flags it?",
      "acceptedAnswer": {
        "@type": "Answer",
        "text": "Yes. Because Avoma analyzes conversation content rather than just activity timestamps, it detects risk indicators such as declining engagement, unresolved objections, missing stakeholders, or no activity on a deal before a rep manually flags it in the CRM. This gives managers earlier visibility into at-risk pipeline and time to act before a deal affects the forecast."
      }
    },
    {
      "@type": "Question",
      "name": "What is the difference between commit and best case in sales forecasting?",
      "acceptedAnswer": {
        "@type": "Answer",
        "text": "A commit represents deals a rep or manager expects to close within the period with high confidence, based on verified engagement and buyer signals. Best case covers deals that could close if specific risks are resolved, usually requiring extra follow-up or a final decision from the buyer. Mixing the two inflates the commit number and reduces forecast accuracy. Avoma structures the submission flow around these categories and maps them to custom CRM values to match how your organization defines them."
      }
    }
  ]
}
</script>