
Sales performance: The metrics, system, and coaching loop to measure and improve it

Table of Contents:
A rep misses quota by 12 points and the CRM shows nothing unusual: same stages, same deal sizes, no obvious cause.
This guide covers the four-layer stack that explains gaps like that, how to diagnose which layer is behind a specific drop, and how to turn that diagnosis into a coaching conversation that moves next quarter's number.
TL;DR
- The 4-layer stack. Outcome and pipeline metrics show what happened and what's coming; process and behavioral signals show why. See the full breakdown.
- Why behavioral signals matter. A win-rate drop that looks unexplainable in the CRM often traces to a specific habit inside the calls themselves. See the example.
- A repeatable process. Plan, track, review, and coach on a cadence matched to how fast each layer moves. See how to build it.
- Diagnosing a gap. Underperformance usually traces to one of four root causes, and the pattern tells you which one. Use the diagnostic table.
- Performance vs. effectiveness vs. efficiency. The three terms get used interchangeably but answer different questions, and mixing them up means fixing the wrong problem. See the difference.
What is sales performance?
Sales performance is how well a sales team or rep converts effort into revenue against a target. Complete measurement combines four layers: outcome metrics, pipeline metrics, process signals, and behavioral signals pulled from the sales conversations themselves. Outcome and pipeline metrics show you what happened and what's coming. Process and behavioral signals show you why, and what to do about it.
Sales performance = outcomes + pipeline + process + behavior.
That's the spine of this guide: measure across all four layers, diagnose which one explains a gap, then coach the specific behavior behind it.
You'll also hear "sales performance," "sales effectiveness," and "sales efficiency" used as if they're interchangeable. They're not, and mixing them up is a fast way to fix the wrong problem, covered in full in the section separating the three terms.
The 4 layers of sales performance measurement
Sales performance measurement has four layers:
- Outcome metrics: What happened
- Pipeline metrics: What's likely to happen
- Process signals: Whether the sales system is working
- Behavioral signals: What's happening inside deals and sales conversations
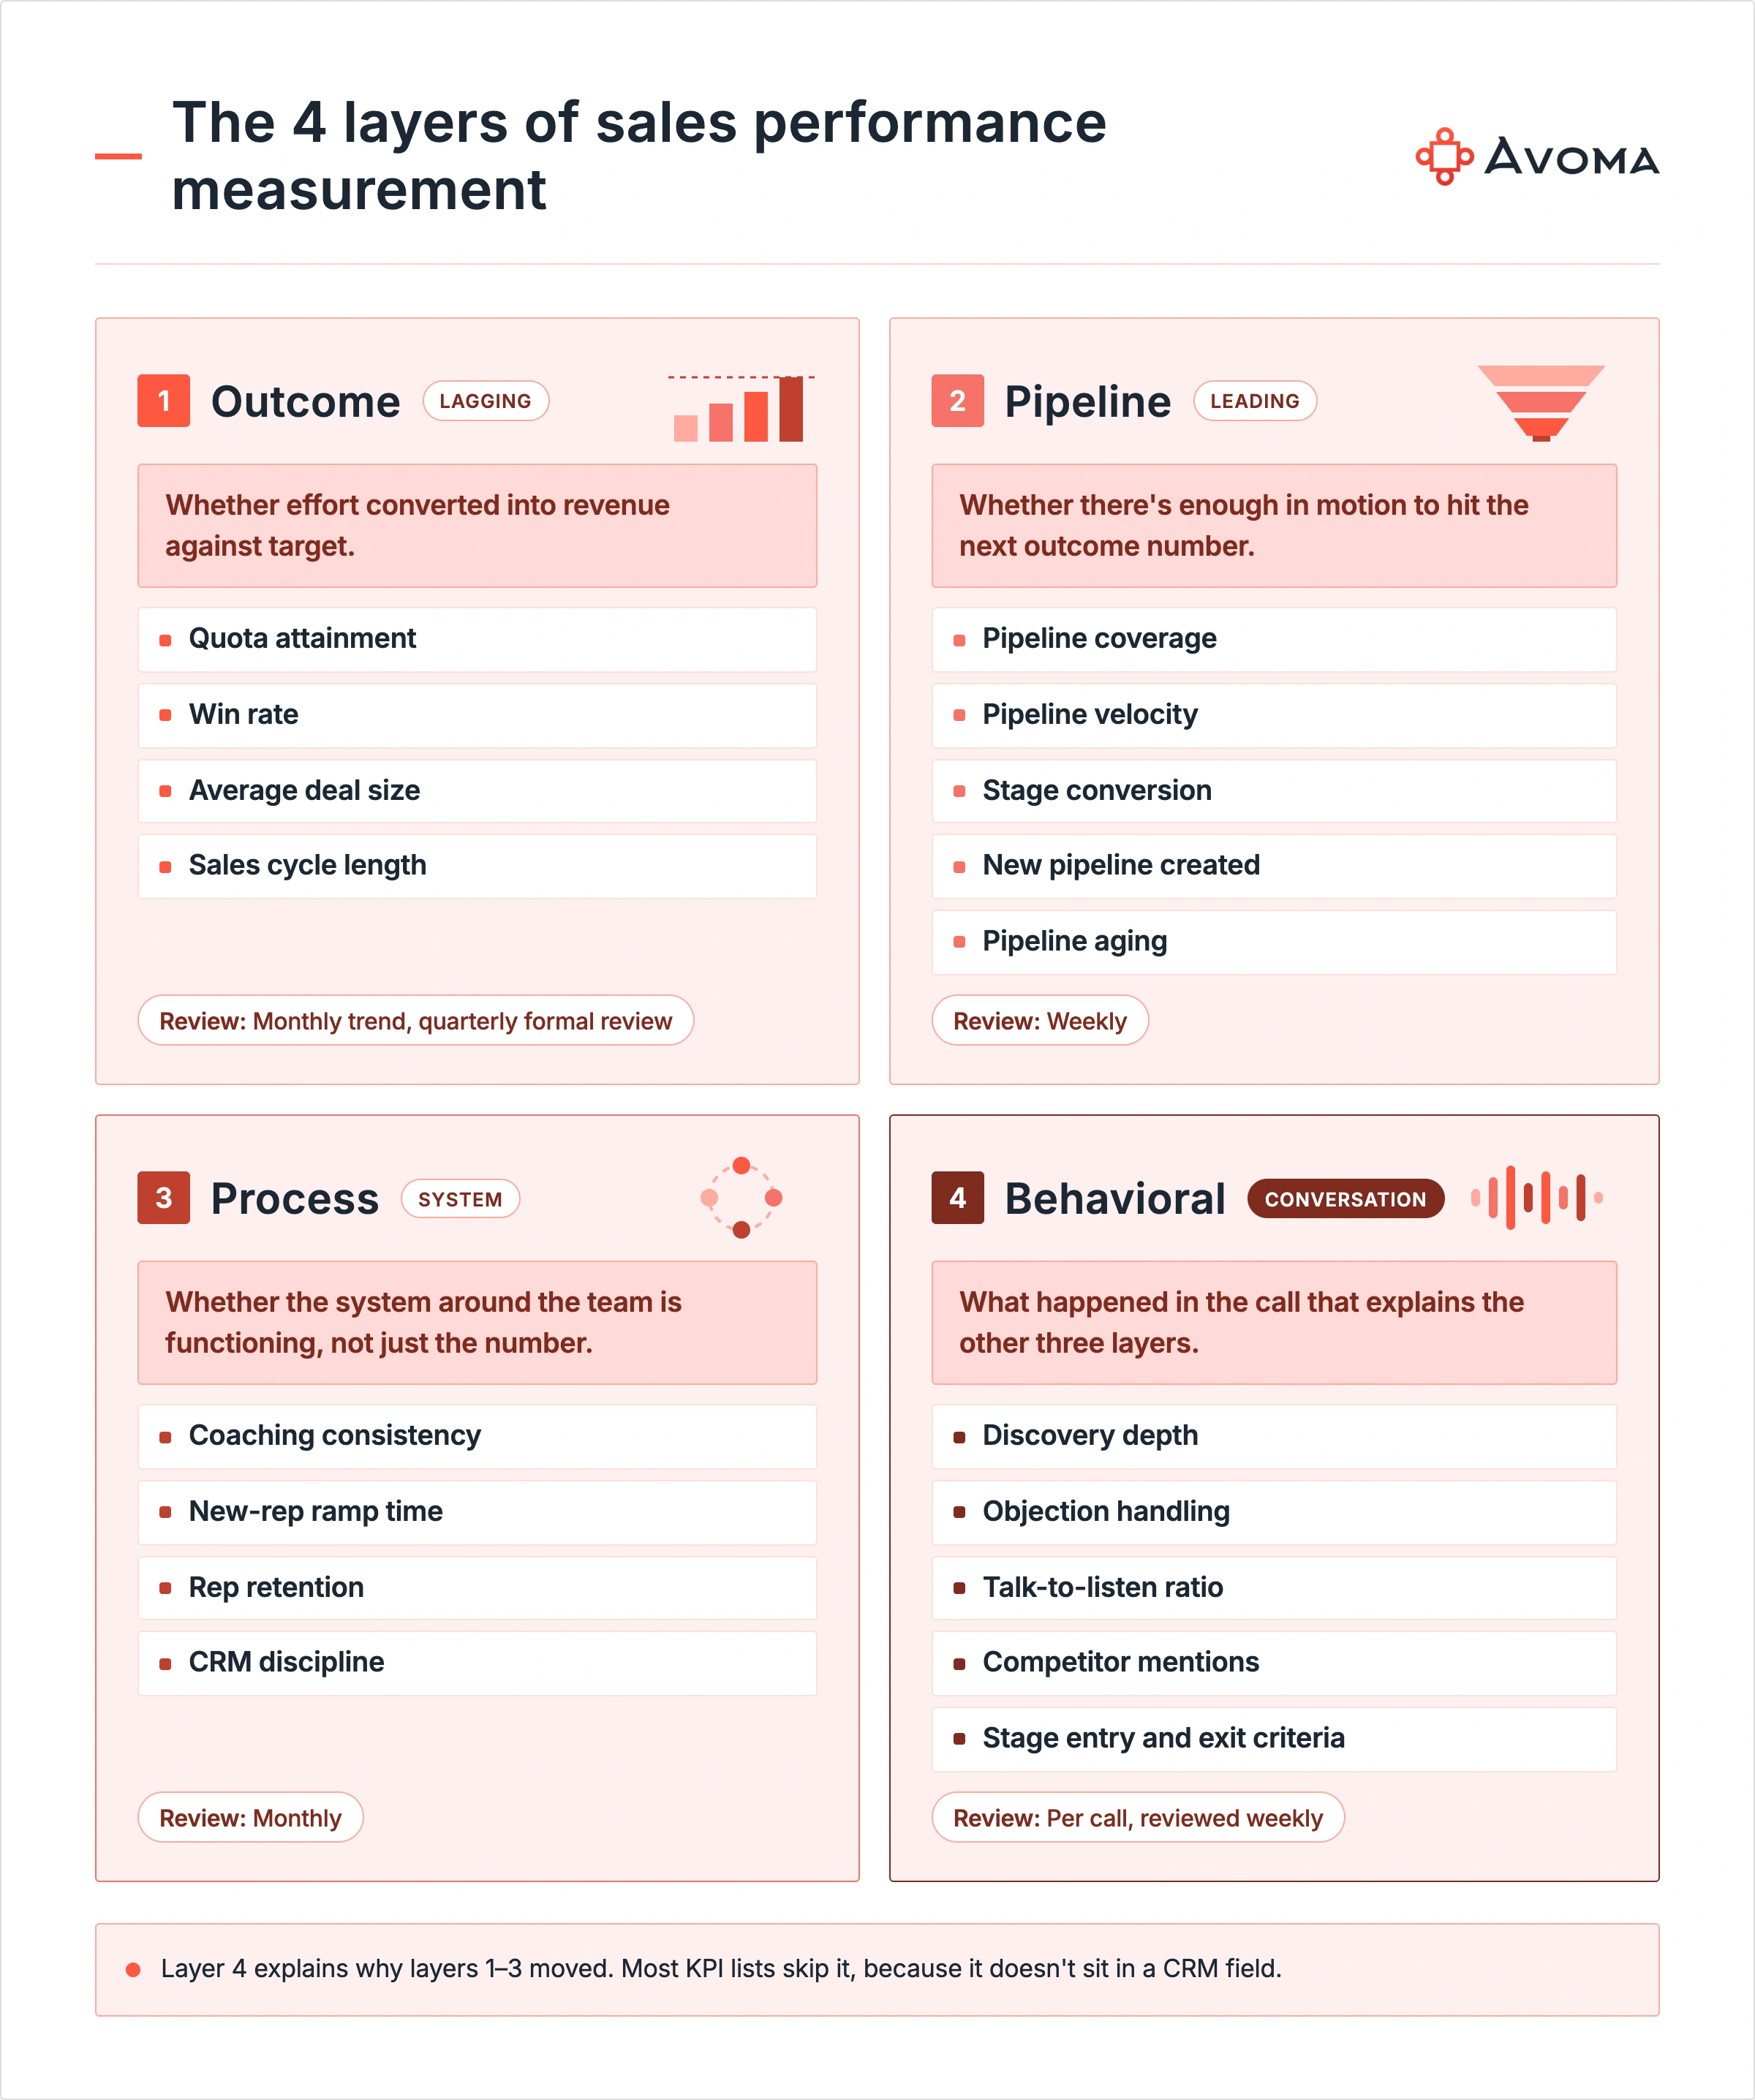
Most frameworks on this topic stop at the first two and call it complete.
Outcome metrics
These are the lagging numbers everyone already tracks. They tell you where the team landed and what contributed to the final revenue number, after the deal is already decided, with nothing left to change.
- Quota attainment. Closed-won revenue divided by quota, times 100.
- Win rate. Deals won divided by qualified opportunities, times 100.
- Average deal size. Total closed-won revenue divided by number of won deals.
- Sales cycle length. Time from qualification to closed-won.
If quota attainment drops from 82% to 67%, you know performance moved. The metric shows you where the change happened, not what's driving it, which is why the layers below matter.
Pipeline metrics
These are leading indicators. They tell you whether there's enough real pipeline, whether it's moving, and where future revenue is at risk, often weeks before an outcome metric would move.
- Pipeline coverage. Open pipeline value divided by remaining quota.
- Pipeline velocity. Number of opportunities, average deal value, win rate, and sales cycle length, tracked together.
- Stage conversion. The percentage of opportunities that move from one stage to the next, and where deals drop out.
- New pipeline created. How much qualified pipeline the team added in the period.
- Pipeline aging. How long deals have sat in their current stage compared with the normal time for that stage.
A rep at 70% of quota with 4x pipeline coverage is in a different position than one at 70% with 0.8x coverage. And 4x coverage means little if half those deals have been sitting in the same stage for 90 days.
Process signals
These track whether the system around the team is functioning, not just the number it produces.
- Coaching consistency. Whether coaching happens on a regular basis, tied to real calls and specific skills.
- New-rep ramp time. How long it takes a new rep to reach full productivity.
- Rep retention. Whether productive reps stay, and whether attrition clusters by manager or tenure.
- CRM discipline. Whether reps keep stages, close dates, and deal details current enough for a manager to trust the pipeline.
A team can hit this quarter's target while coaching happens sporadically, CRM data goes stale, and new reps take 9 months to become productive. Revenue exposes those problems eventually. Process signals surface them sooner.
Behavioral signals
These come from what happens inside the call itself, the evidence behind deal progression that a CRM field can't capture on its own.
- Discovery quality. Whether the rep gets past surface-level questions into impact, urgency, stakeholders, and decision criteria.
- Objection handling. Whether the rep gets to the real objection and addresses what's behind it.
- Talk-to-listen balance. Whether the buyer gets enough room to talk while the rep still directs the conversation.
- Competitor mentions. Which competitors come up, why, and how the rep responds.
- Stage entry and exit criteria. Whether a deal has the evidence required to move from one stage to the next, not just a date change.
This is the layer that explains why an outcome metric moved, not just that it did. It's the layer almost every KPI list on this topic skips, because it doesn't sit in a CRM field on its own.
| Layer | What it measures | Example metrics | Review cadence |
|---|---|---|---|
| Outcome (lagging) | Whether effort converted into revenue against target | Quota attainment, win rate, average deal size, sales cycle length | Monthly trend, quarterly formal review |
| Pipeline (leading) | Whether there's enough in motion to hit the next outcome number | Pipeline coverage, pipeline velocity, conversion rate by stage, new pipeline created, pipeline aging | Weekly |
| Process | Whether the system around the team is functioning, not just the number | Coaching consistency, ramp time, rep retention, CRM discipline | Monthly |
| Behavioral (conversation-level) | What happened in the call that explains the other three layers | Talk-to-listen ratio, discovery depth, objection handling, next-step commitment rate | Per call, reviewed weekly |
The four layers function as one diagnostic chain rather than four separate scorecards. A team can look healthy on outcome and pipeline and still be sitting on a process or behavioral problem that hasn't reached the revenue number yet, which is exactly the gap the next section walks through.
Why behavioral signals matter
A team's win rate drops from 32% to 24% in one quarter, with pipeline volume unchanged. The CRM shows nothing unusual: same stages, same deal sizes. A pass through the call recordings tells a different story.
| What the CRM showed | What the calls showed |
|---|---|
| Win rate down from 32% to 24% | Discovery calls running 40% shorter than the prior quarter |
| Same stages, same deal sizes, nothing flagged | Half the usual number of open-ended questions asked; reps pitching earlier and qualifying less |
The outcome metric flagged that something was wrong. The behavioral layer is what told the manager exactly what to fix, down to the specific habit (pitching before qualifying) a coaching conversation could target that same week.
Expert Insight: In Avoma's experience working with revenue teams, the behavioral layer is usually the one leadership asks for first once they see it exists. A quota number can't tell a manager what to say in a coaching conversation. A discovery-question count that's fallen by half can.
Behavioral signals earn their place beyond a single quarter's diagnosis, too. They give a manager a way to coach across the whole team without listening to every call, which is the piece the next two sections build on: first the system that turns four layers into a habit, then the review and coaching loop that runs on top of it.
Building a sales performance management process
Sales performance management is the repeatable cycle of planning targets, tracking metrics, reviewing performance, and coaching to close gaps, not a report someone reads once a quarter.
- Plan. Set a target for each of the four layers, not just quota, and name who owns tracking each one.
- Track. Pull outcome and pipeline metrics from the CRM, and behavioral metrics from call data, on a cadence that matches how fast each one moves.
- Review. Walk through the numbers with the people who can act on them, at the cadence below.
- Coach. Turn every review into one specific action, then check whether it moved the next period's numbers.
Skip any one step and the system breaks in a predictable way. Plan without track, and targets never meet real data. Track without review, and the numbers sit in a dashboard nobody discusses. Review without coach, and the meeting ends with a score but no change in what the rep does next.
Compensation and incentive design often gets bundled into "sales performance management" as a category. That's a separate discipline, commission structuring and plan design, with its own vendors, and folding it in here would blur what this guide is trying to help you build: a measurement and coaching system, not a comp plan.
| Cadence | What's reviewed | Owner |
|---|---|---|
| Weekly (manager level) | Pipeline health, deal-stage movement, behavioral flags from recent calls | Sales manager |
| Monthly (team level) | Outcome trend, coaching activity, ramp progress for new reps | Sales manager, enablement |
| Quarterly (formal review) | Full stack across all four layers, targets reset for next quarter | Sales leader |
Pro Tip: Assign one owner per layer before you build anything else. A number with no named owner stops getting checked within a month.
Turning performance data into coaching
The review
- State the outcome number: win rate or quota attainment, whichever applies.
- Bring the pipeline, process, or behavioral evidence that explains it, not a guess about it.
- Name one or two specific, observable gaps, not a general "do better."
- Agree on one concrete action before the meeting ends, and write it down.
A review built on the CRM number alone sounds like: "Your win rate is down eight points this quarter. Let's turn that around." A review built on the number plus call evidence sounds like: "Your win rate is down eight points, and in your last six discovery calls you asked an average of two open-ended questions instead of the usual six. Let's get back to a full discovery pass before you pitch." The second version gives the rep something they can change on the next call.
Pro Tip: Watch for recency bias (grading the quarter on the last two weeks) and inconsistent standards across reps. Use the same review structure and the same evidence types for every rep, every time, or the review stops being fair and starts being whatever the manager remembers.
The coaching loop
A review structure fixes what happens once a month. Coaching has to happen every week, for every rep, without eating a manager's whole calendar, which only works if someone can score every call against a defined rubric instead of a manager's gut sense of how a call went.
This is the job Avoma's conversation intelligence is built for. AI-generated scorecards score every recorded call against a team's own rubric, and Ask Avoma lets a manager ask a coaching question in plain language, "which reps are struggling with objection handling this month?", across meetings, deals, and playlists, instead of sampling recordings and hoping the sample is representative.
Data Point: Avoma states its core value proposition as saving revenue teams 4+ hours per rep per week on manual meeting work, including note review and call prep, according to Avoma's own published positioning.
Diagnosing sales underperformance
Underperformance usually traces back to one of a few root causes. The behavioral data from the four-layer stack is what tells you which one you're looking at.
- Not enough pipeline. A volume problem.
- Pipeline that doesn't convert. A qualification or skill problem.
- Deals that stall mid-cycle. A process or messaging problem.
- Deals that close late and small. A pricing or positioning problem.
Resist the instinct to jump straight to "the reps aren't trying hard enough." That's a conclusion, not a diagnosis, and the pattern rarely supports it once you look.
| Pattern | Likely issue | Inspect |
|---|---|---|
| Low pipeline coverage | Pipeline creation | Prospecting, lead sources, territory coverage |
| Pipeline exists, conversion is weak | Qualification or selling skill | Discovery quality, objection handling |
| Deals stall mid-cycle | Deal progression | Stakeholder engagement, stage exit criteria |
| Deals close late or small | Positioning or negotiation | Competitor context, pricing objections, negotiation patterns |
A team with strong pipeline coverage and a falling win rate is worth checking against the behavioral layer before writing it off as a volume problem. Pulling the behavioral data usually shows the pattern within a handful of calls, reps skipping multi-threading on larger deals, for instance, so a single champion goes quiet and the deal stalls with no one left to talk to.
Sales performance vs. sales effectiveness vs. sales efficiency
| Sales performance | Sales effectiveness | Sales efficiency | |
|---|---|---|---|
| Question it answers | Are we hitting the number, and why? | Are we selling well? | How much time or cost does it take? |
| What it looks at | Quota, pipeline, deal behavior | Discovery, messaging, methodology | Ramp time, cost, productivity |
| Typical symptom | "Are we on track?" | "Why do we keep losing?" | "Why does selling take so long?" |
The three terms get used interchangeably, but they answer different questions, and the fastest way to know which one you're trying to fix is to start from the symptom.
- "Deals are taking too long to close" points to sales efficiency first.
- "Reps keep losing to the same objection every time" points to sales effectiveness first.
- "I don't know if we're on track for the quarter" points to sales performance first, the measurement system this guide covers.
Performance measures the result and the behavior behind it. Effectiveness measures whether the method works. Efficiency measures whether it's fast and cheap enough. A team can be measuring performance well and still have an effectiveness or efficiency problem underneath it, which is why most mature sales orgs need visibility into all three.
What to look for in sales performance management software
Sales performance management software encompasses various components of the performance system. Some products focus on compensation and incentive management. Others focus on enablement, analytics, coaching, or conversation intelligence.
| Capability area | Built for | What it won't solve on its own |
|---|---|---|
| Compensation and incentive | Commission calculation, plan design, payout accuracy | Won't tell you why a rep is missing quota |
| Enablement | Training content, onboarding, ramp curriculum | Won't score actual call behavior at scale |
| Conversation intelligence | Call-level coaching, behavioral data, deal visibility | Won't calculate commissions or build a comp plan |
Avoma is sales performance management software grounded in conversation and deal data. It combines rep performance scorecards, pipeline analytics, deal-methodology intelligence, and revenue forecasting to help sales teams connect buyer conversations to deal health and performance.
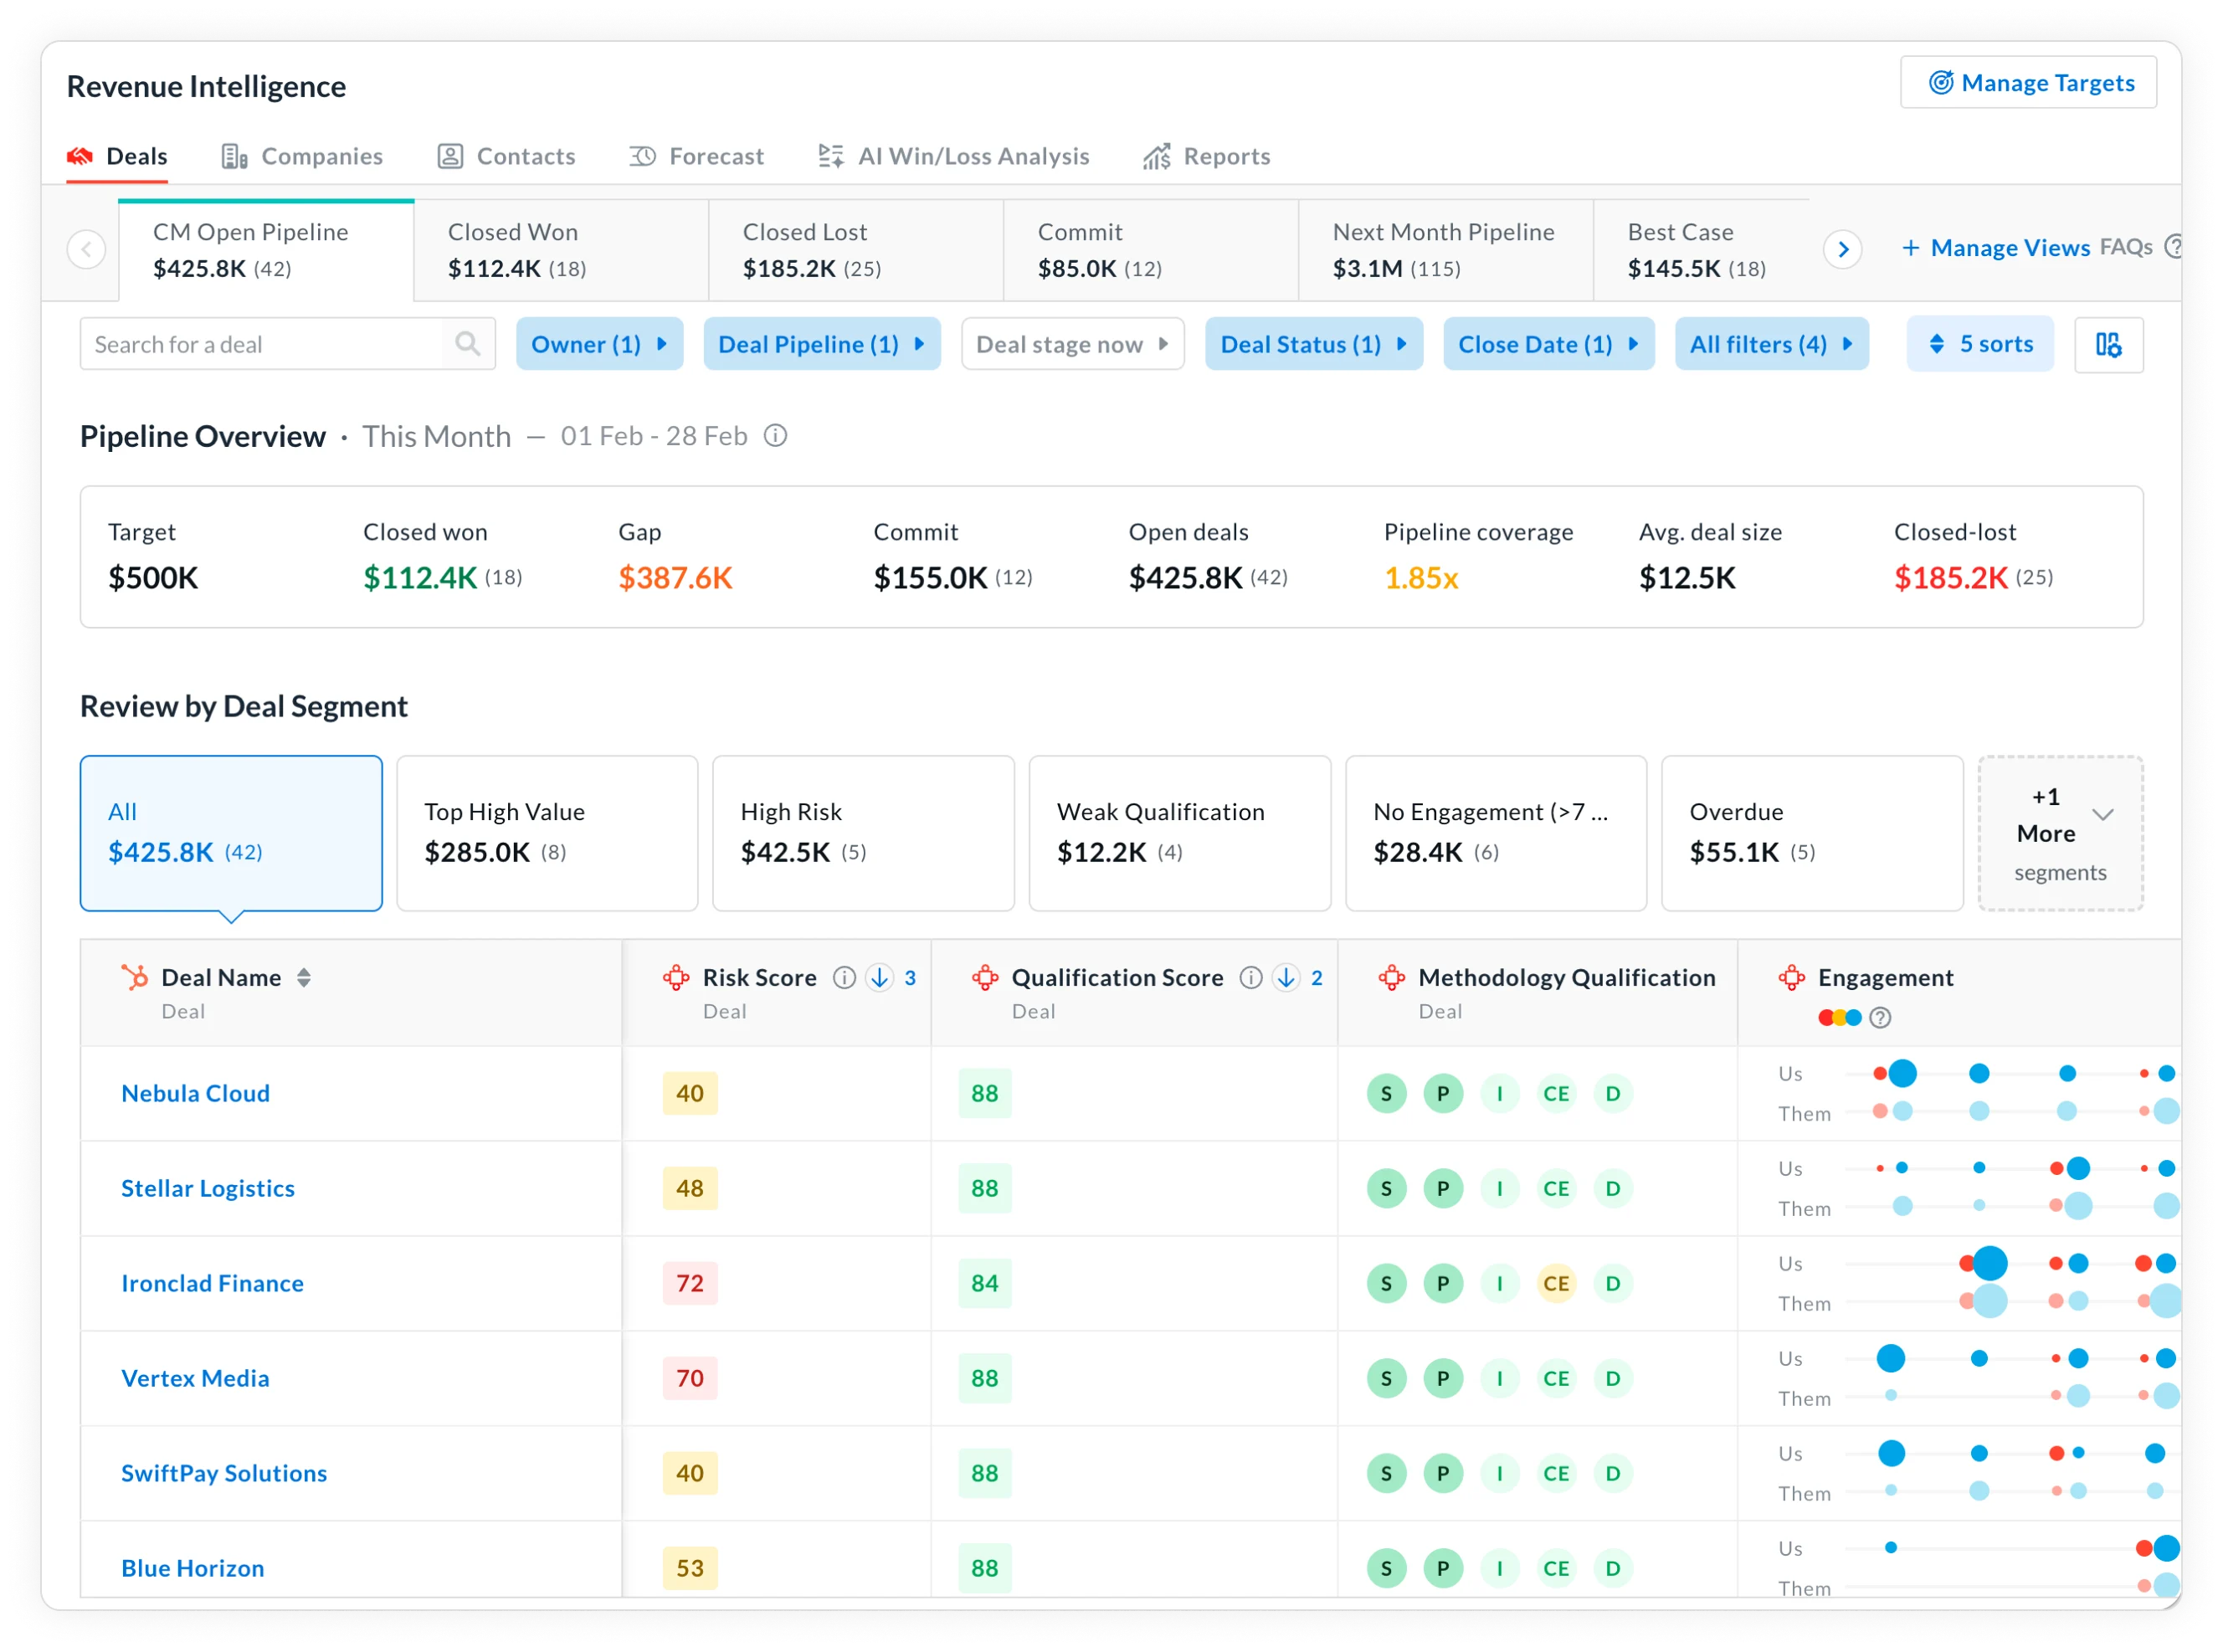
Managers can evaluate calls against custom or established sales methodologies, identify skill and qualification gaps, monitor at-risk deals, and use deal engagement and CRM activity to inform forecasts.
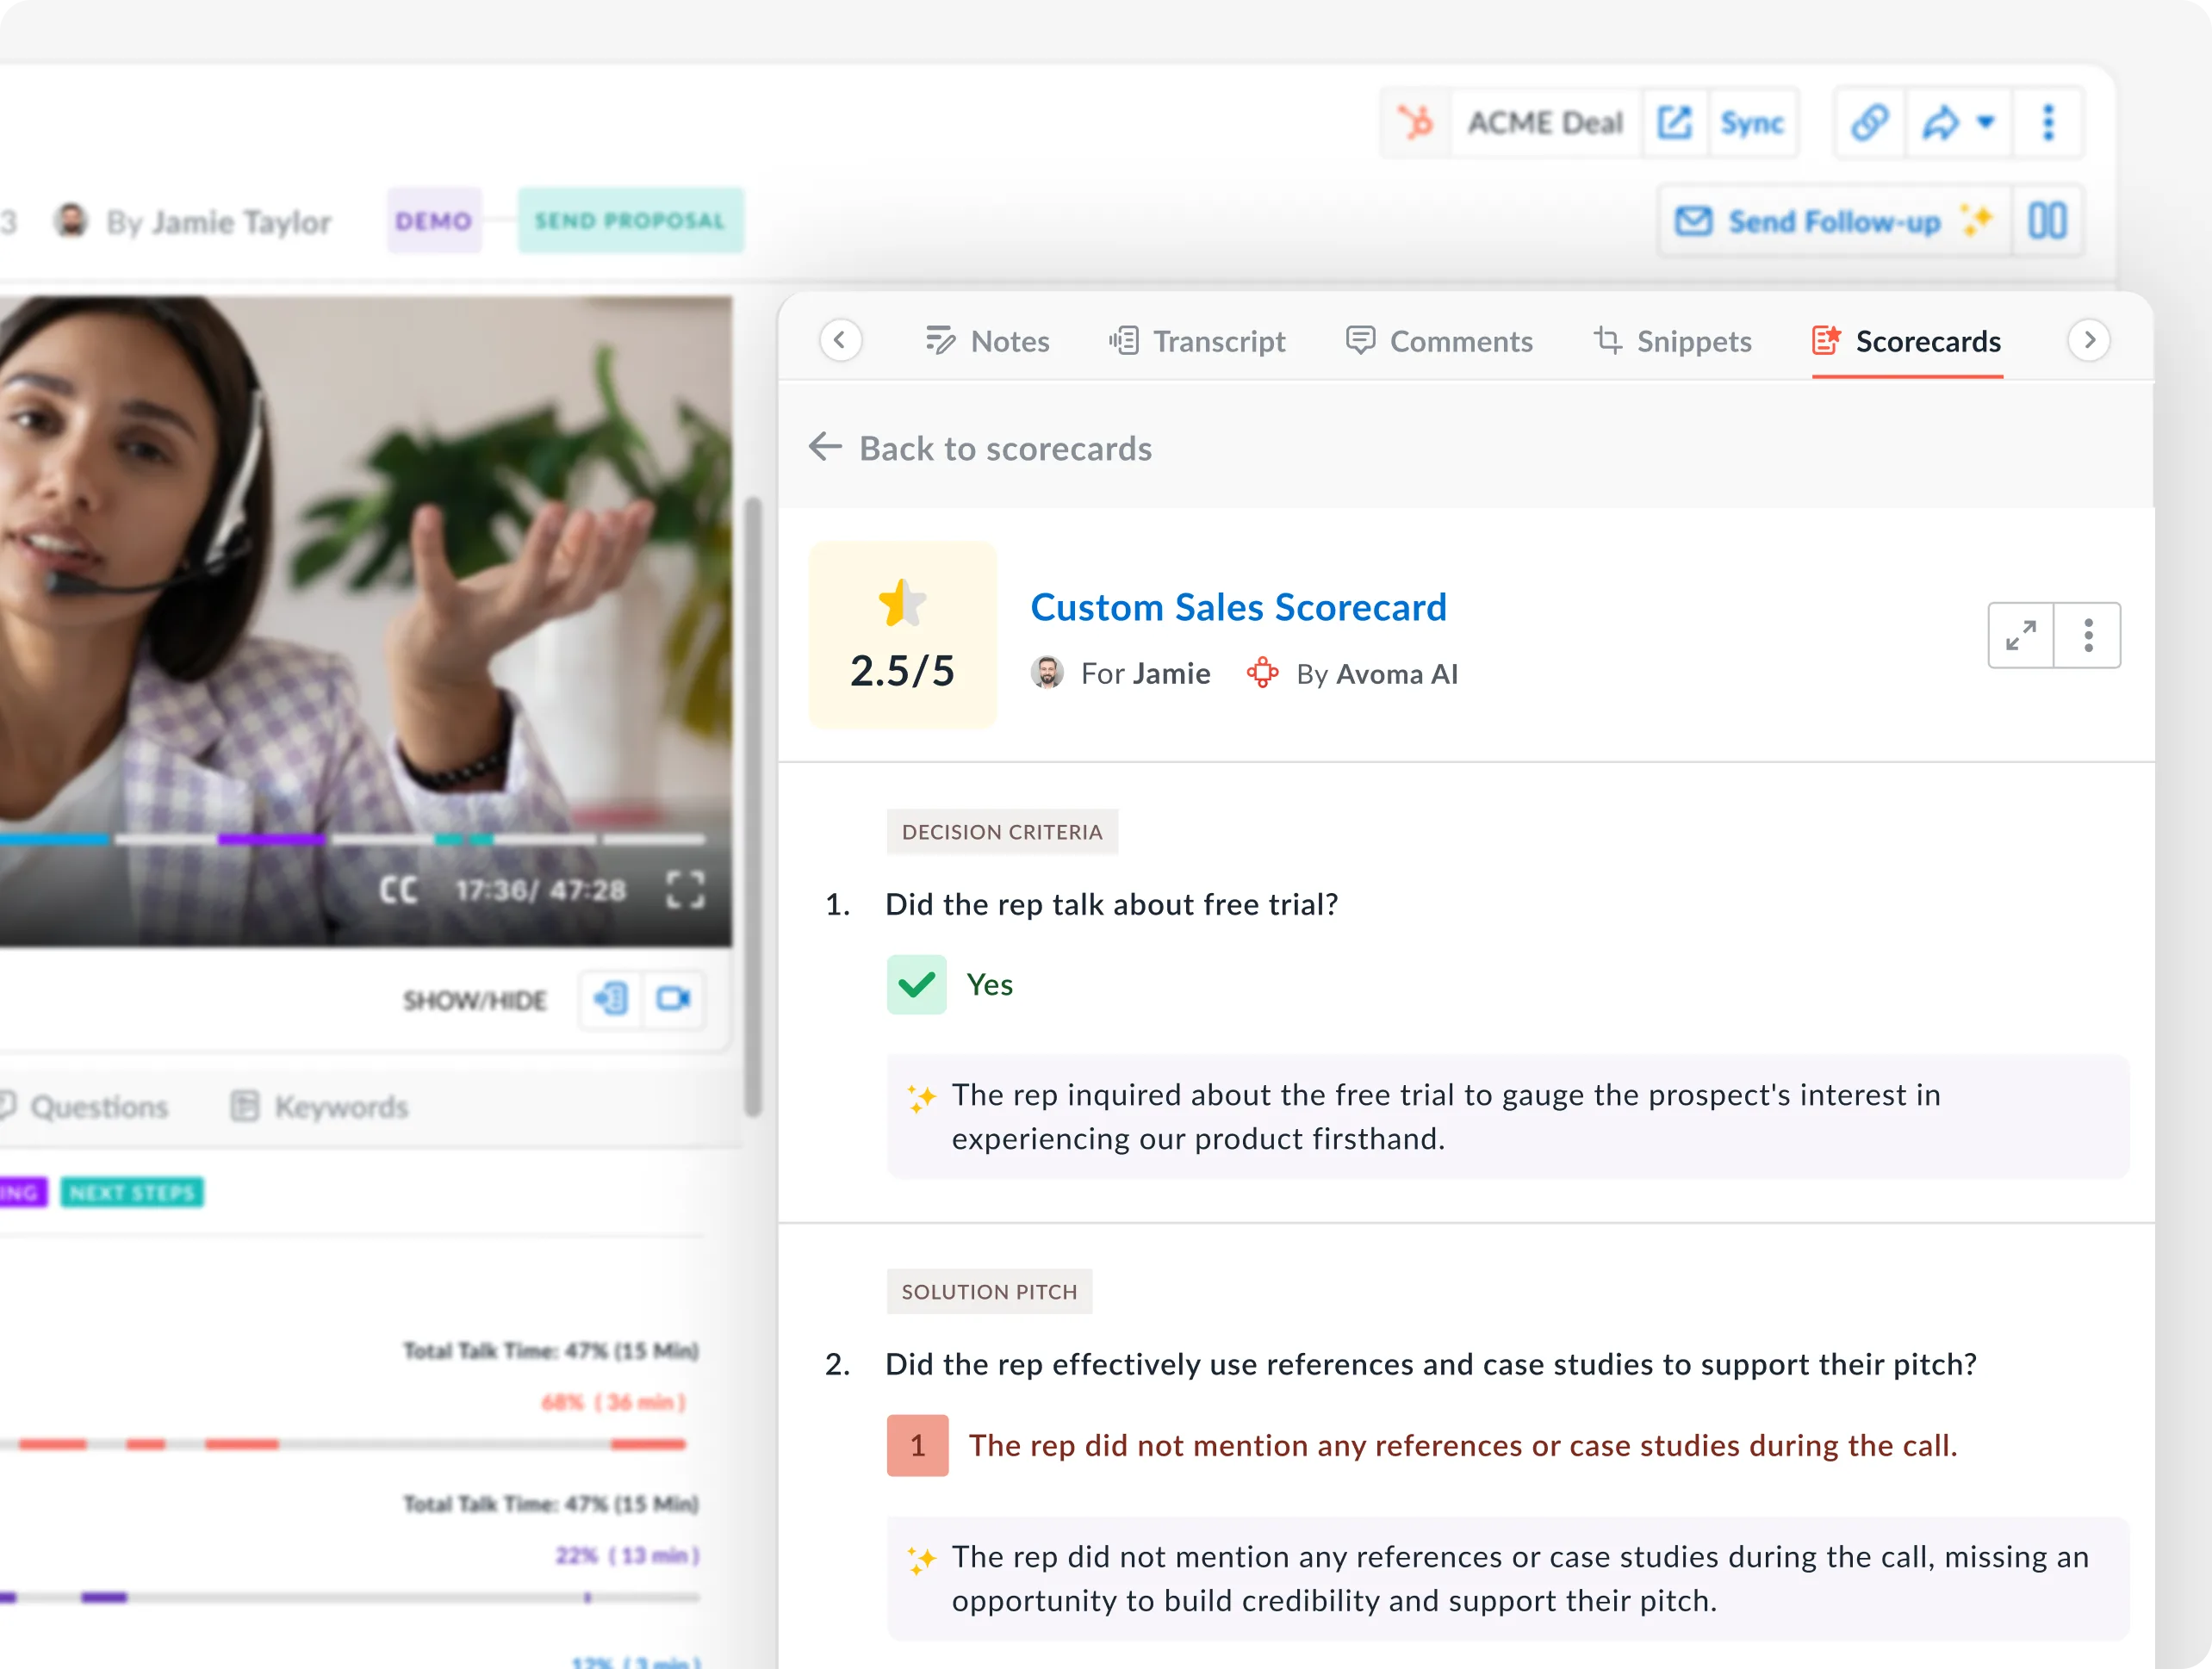
Avoma connects the behavioral layer with pipeline and deal-level signals. It can score recorded calls against a team's rubric, track methodology coverage and qualification gaps, surface deal engagement and risk signals, and provide visibility into rep performance and forecast health. Ask Avoma also lets managers query meetings, deals, and playlists in plain language to investigate performance patterns without manually reviewing every conversation.
See how Avoma turns every call into performance data your reviews and coaching can run on. Start a free trial or book a demo.
Frequently Asked Questions
Sales performance metrics should be reviewed at different intervals based on how quickly they change. Pipeline health, deal movement, and behavioral signals are useful for weekly reviews, while outcome trends and process measures are better suited to monthly analysis. Formal quarterly reviews can assess the complete performance picture and reset targets. Using different cadences helps managers identify emerging problems without overreacting to short-term fluctuations.
Yes. Strong pipeline coverage does not guarantee quota attainment because pipeline quality and conversion also matter. A team can have substantial pipeline value while deals remain stalled, poorly qualified, or unlikely to close. Reviewing stage conversion, pipeline aging, and behavioral evidence from sales conversations can help determine whether apparently healthy pipeline is actually capable of producing the expected revenue.
Managers should investigate conversion quality and sales behavior rather than assuming the problem is pipeline volume. Useful signals include discovery depth, objection handling, qualification practices, stakeholder engagement, and whether deals meet defined stage criteria. Call-level evidence can reveal changes that CRM data may not capture, such as shorter discovery conversations, fewer open-ended questions, or reps pitching before completing qualification.
Yes. Conversation intelligence can add behavioral data that is usually missing from CRM-based performance reporting. It can evaluate signals such as discovery quality, objection handling, talk-to-listen balance, competitor mentions, and adherence to call-scoring criteria. This makes it possible to connect changes in outcomes, such as win rate, with observable selling behaviors. Avoma, for example, uses AI-generated scorecards to evaluate recorded calls against a team's defined rubric.
Start by comparing pipeline availability with conversion performance. Low pipeline coverage usually points toward a pipeline creation problem. If sufficient pipeline exists but conversion remains weak, qualification or selling skills deserve closer examination. Managers can then inspect discovery quality, objection handling, stakeholder engagement, and other behavioral signals to identify a more specific cause before deciding what to coach.
Call data is most useful when CRM metrics identify a performance change but do not explain its cause. CRM data can show outcomes, pipeline movement, stages, and deal values, while call data can reveal how discovery, qualification, objection handling, or stakeholder conversations are being executed. The two sources are complementary: CRM data helps locate the performance gap, while conversation-level evidence can help explain why it occurred.
Tracking too many metrics can make performance reviews harder to interpret and reduce attention on signals that managers can actually influence. A practical approach is to select metrics across outcomes, pipeline, process, and behavior, then review each at an appropriate cadence. Metrics should help answer a specific diagnostic question, such as whether pipeline is sufficient, deals are converting, the sales process is functioning, or a particular behavior requires coaching.
Measure coaching by looking for changes in the specific behavior being coached and then checking whether related performance indicators improve over time. For example, if weak discovery is associated with falling conversion, managers can track discovery behaviors in subsequent calls before evaluating later changes in win rate. This creates a measurable loop between performance evidence, a specific coaching action, behavioral change, and subsequent results.


Dive into Our Latest
Avoma Insights.



What's stopping you from turning every conversation into actionable insights?


