
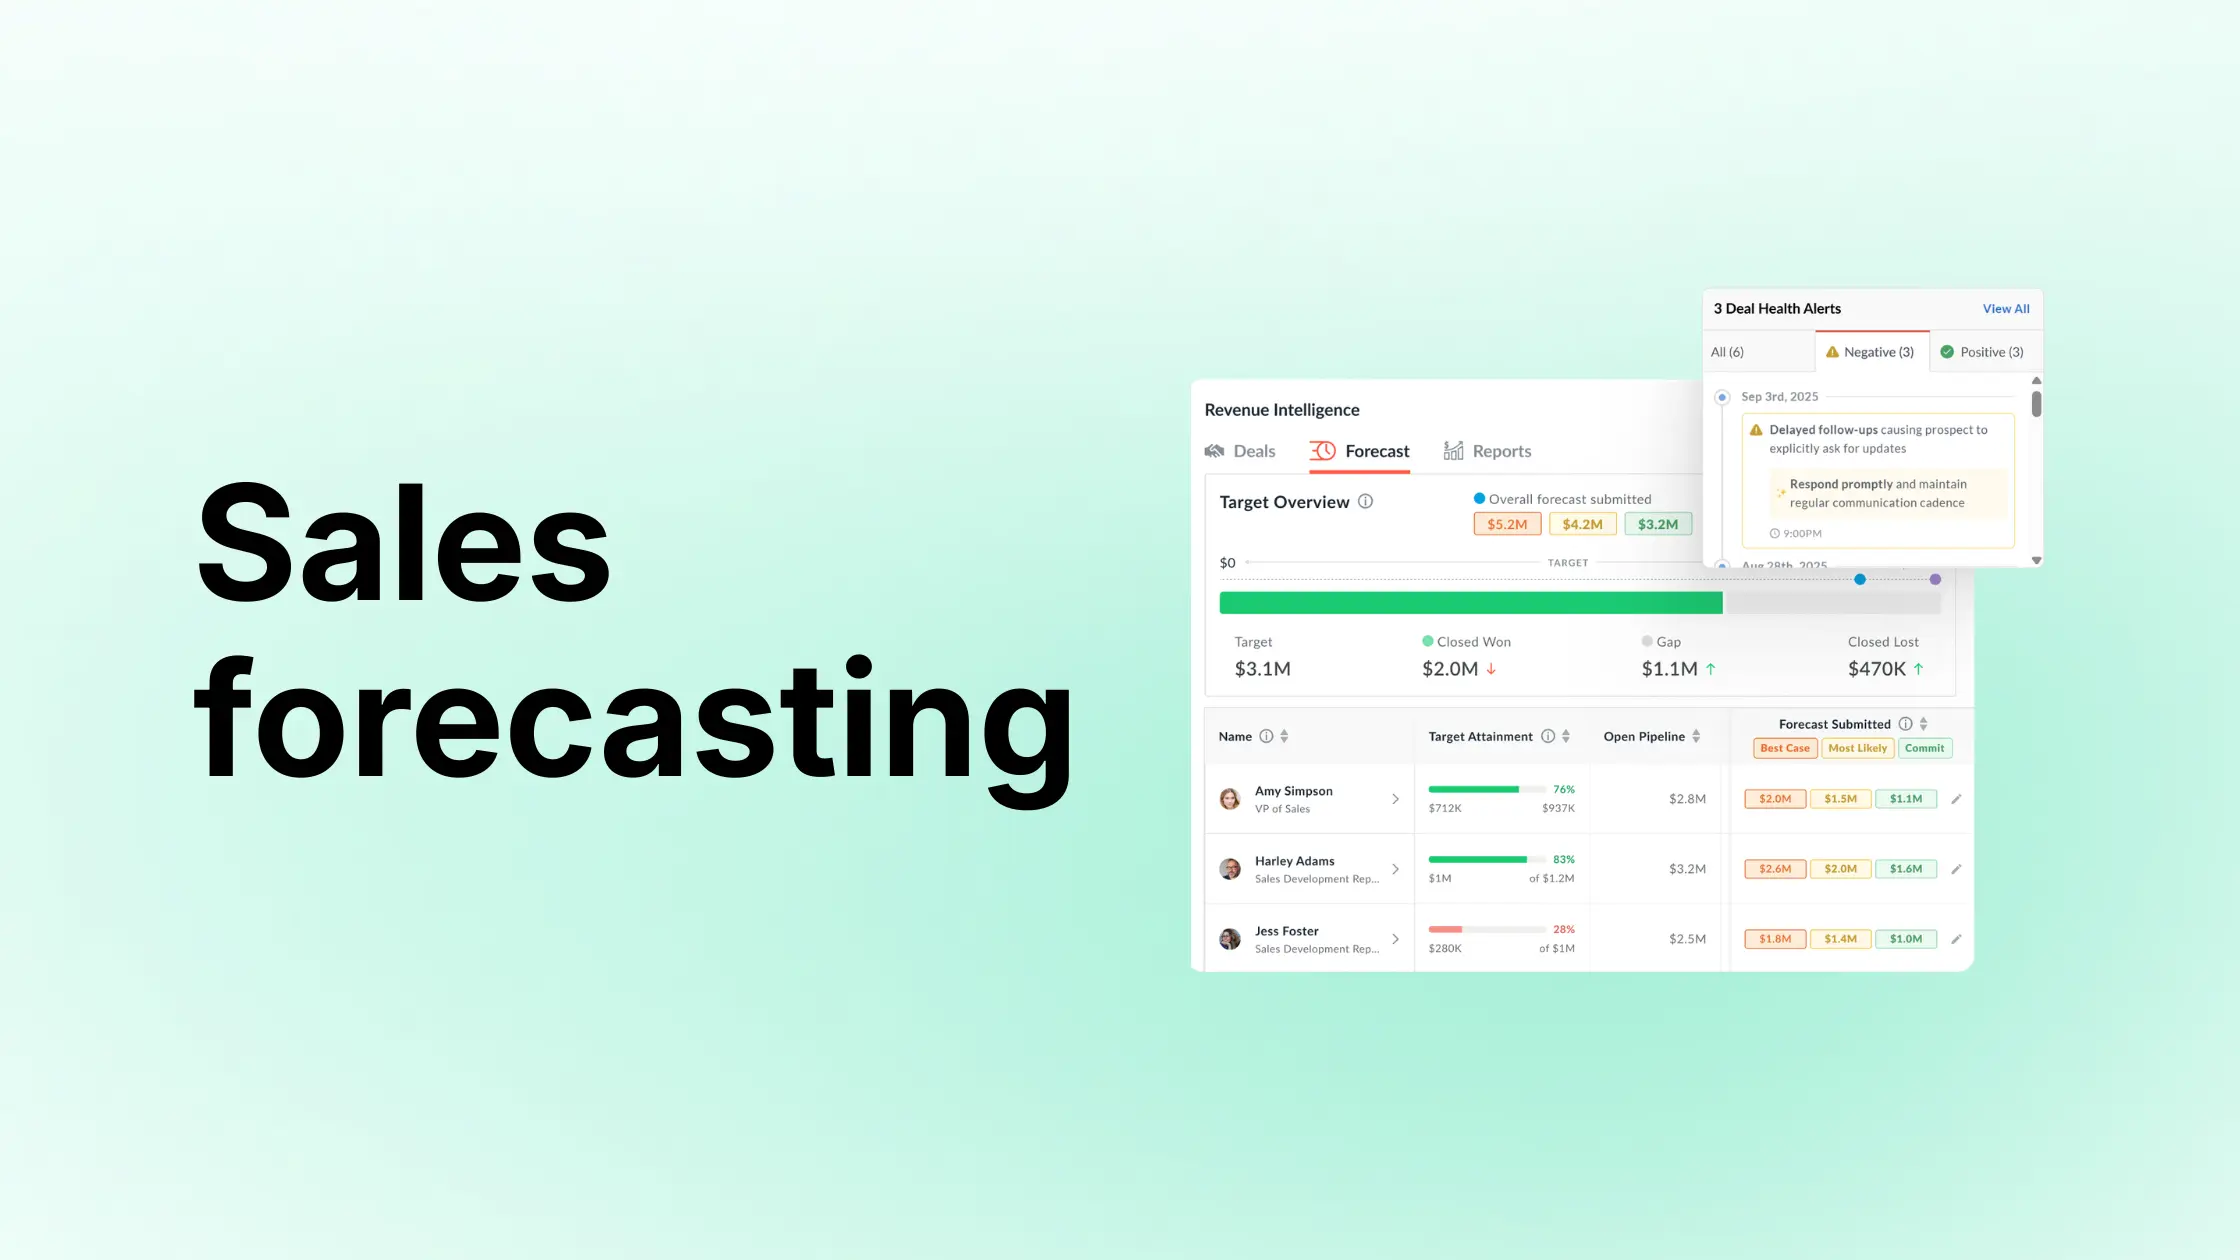
Sales forecasting: The complete guide (methods, tools, and AI)

Table of Contents:
Most forecasts fail because the rules are vague.
When "Commit" is a gut call and numbers shift the day before close, Finance stops trusting you. And once that trust is gone, it's hard to get back.
The fix is governance: clear stage exits, evidence-backed commits, accuracy metrics, and a locked weekly cadence. AI then makes that structure useful by flagging risks and surfacing deal reality before the quarter ends.
This guide covers it all: Definition, methods, approach, governance, metrics, tools, AI, and how to build the process from scratch.
What is sales forecasting?
Sales forecasting is how you estimate future revenue using pipeline data, win rates, sales cycle history, CRM records, and past performance. It's what the sales org hands to Finance so they can set targets, plan headcount, and make resource decisions.
But even the right inputs break down if reps can move close dates on a whim or call Commit with nothing to back it up.
Forecasting works when the process is enforceable, with clear stage exits, written Commit rules, and weekly roll-ups that stay locked.
Why sales forecasting matters
A reliable forecast does more than predict revenue. It shapes decisions across the entire business.
- Revenue predictability. When Finance can trust the number, they can plan. Hiring approvals, budget allocations, and board commitments all run on forecast data. An unreliable forecast doesn't just create a miss — it erodes credibility with everyone who depends on the number.
- Better hiring and resource decisions. Sales headcount planning, marketing spend, and capacity modeling all require a credible revenue projection. If your forecast is consistently off, you're either over-hiring into a weak quarter or scrambling to staff up when pipeline suddenly closes.
- Investor and board confidence. For growth-stage companies, forecast accuracy is a signal of operational maturity. A team that can call quarters within 5% builds more trust than one that beats low bars or misses ambitious ones.
- Stronger Finance-Sales alignment. A shared, evidence-based forecast gives Finance and Sales a common language. Disagreements shift from "your number is wrong" to "here's the deal-level evidence." That's a more productive conversation.
- Proactive pipeline management. When forecasts are built on stage-weighted deal data and inspection cadences, managers spot coverage gaps weeks before quarter-end, not the day before.
Why do sales forecasts fail?
Your team probably isn't bad at forecasting. The process just lets bad habits slide.
Sandbagging, hero commits, last-minute changes with no explanation: these all happen because the system allows them. So the forecast becomes noise instead of a reliable number.
The 3 most common culprits:
1. Governance gaps. Stage exits are fuzzy. "Commit" means something different to every rep. Without clear criteria and an audit trail, your CRM slowly loses credibility.
2. Incentive misfires. If reps get rewarded for beating a low bar, they'll set a low bar. If managers celebrate big calls that miss, they'll keep making them. You end up measuring performance theater rather than forecast accuracy.
3. No accuracy tracking. If you're not measuring MAPE, WAPE, or bias, there's no feedback loop. And without accountability at the AE or manager level, there's no reason for the number to improve.
Forecasting maturity: where does your team sit?
Before choosing methods or tools, it helps to know where you're starting from. Most sales orgs fall somewhere on this curve:
- Ad hoc. Forecasting is a gut call. Numbers change daily. Finance doesn't trust the number.
- Repeatable. Categories exist and a cadence is set, but enforcement is inconsistent and accuracy isn't tracked.
- Managed. Stage exits are enforced, accuracy is measured, and bias gets surfaced and coached.
- Optimized. AI flags deal risk, submission history drives coaching, and forecast accuracy is a team-level KPI tied to comp.
Most teams overestimate where they are. If you can't answer "what was our MAPE last quarter by rep?" you're probably at repeatable, not managed.
Knowing your stage tells you which recommendations in this guide actually apply to you right now. For a guide on moving up, see Building a culture of revenue forecasting.
What are the main sales forecasting methods?
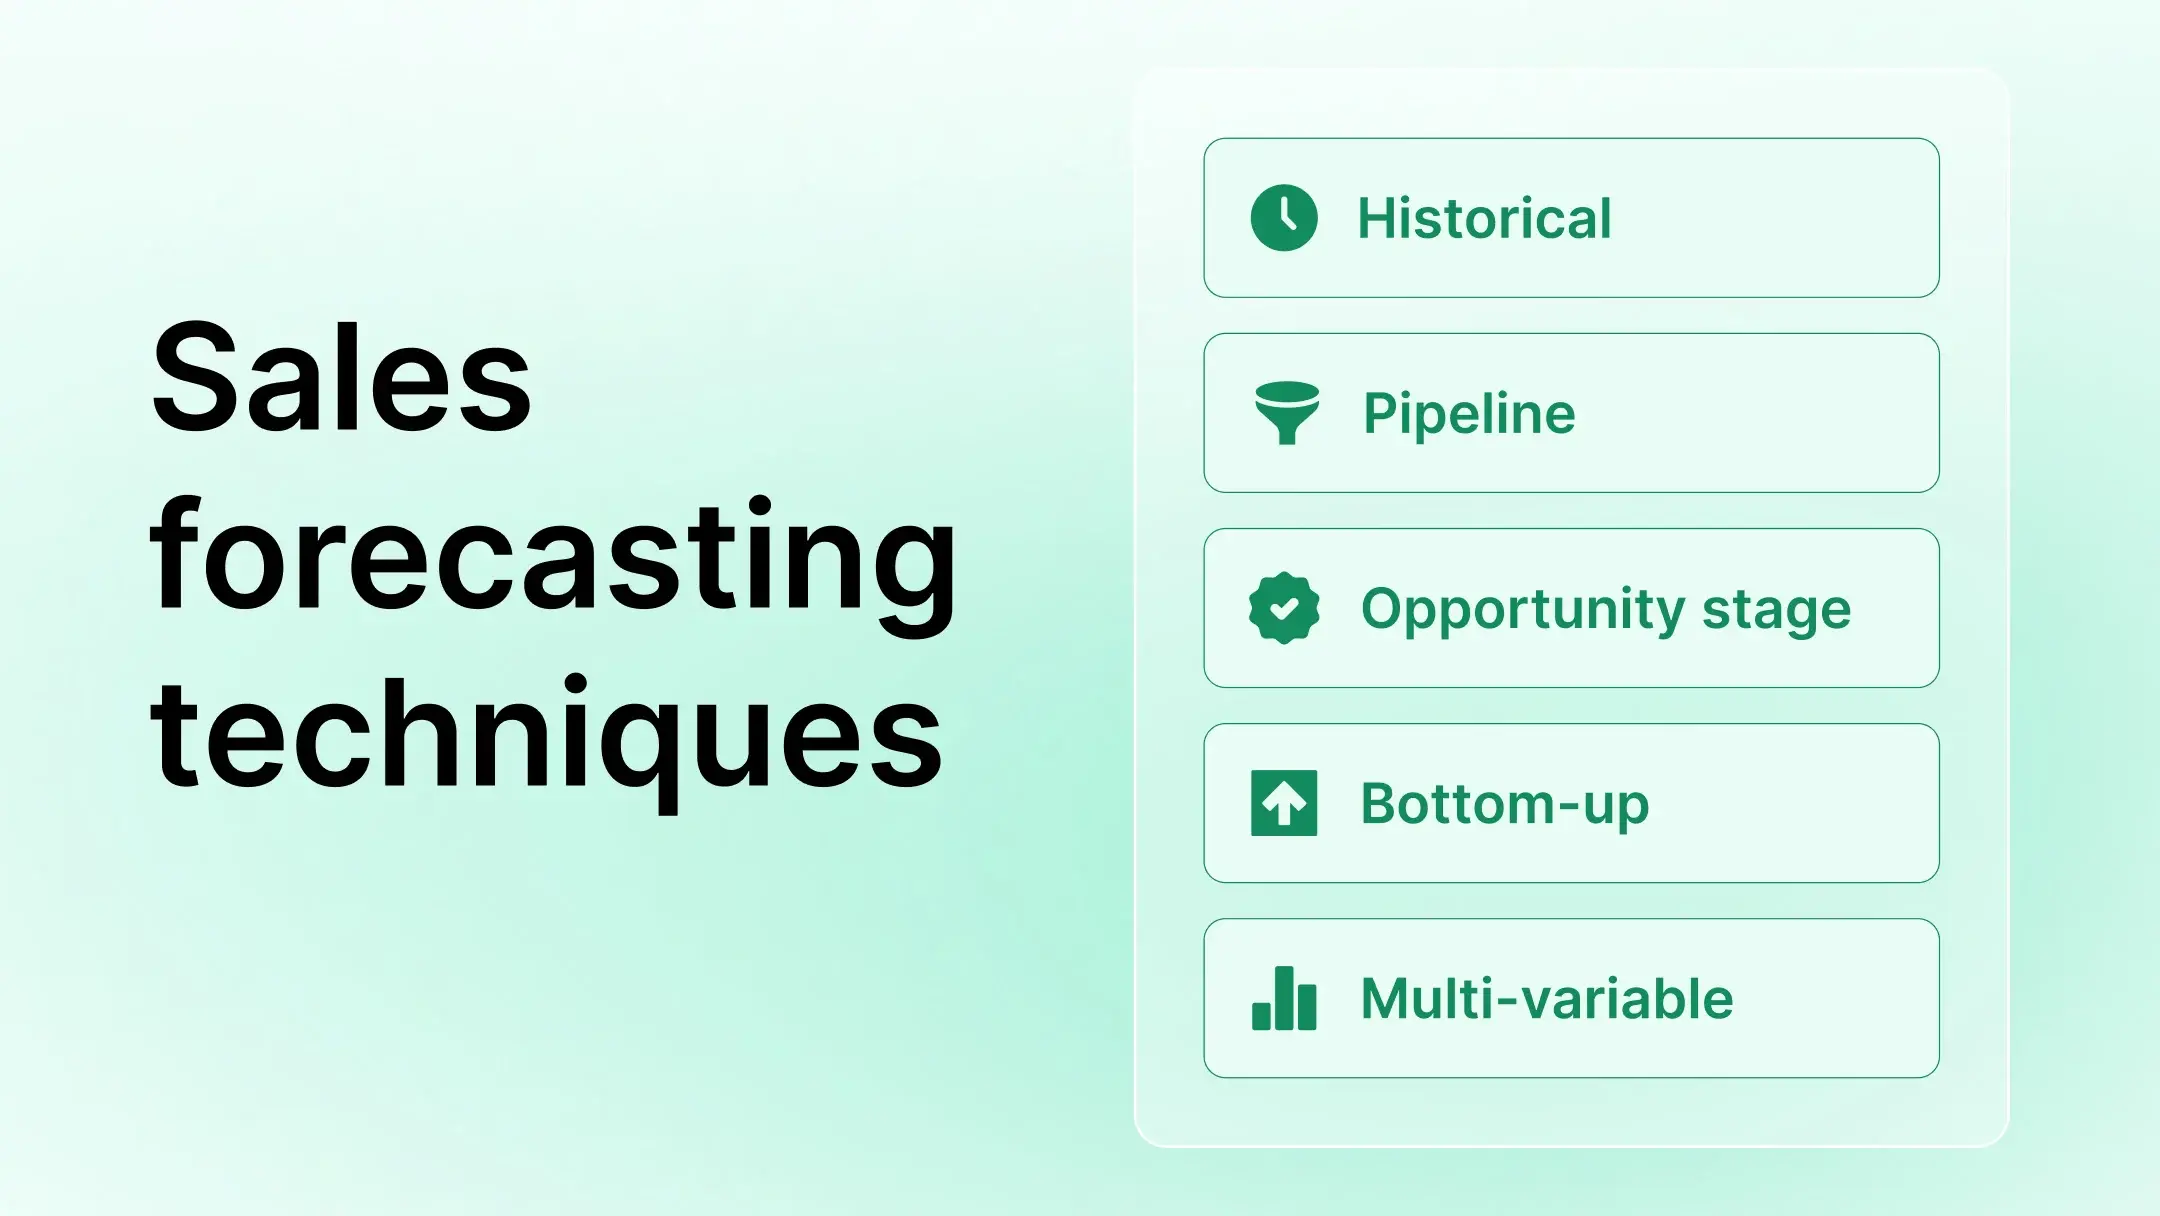
Most teams use a combination of methods, and the right mix depends on your sales cycle and data quality. The 5 most common:
- Historical forecasting: uses past performance to project future revenue. Works in stable environments; misses live pipeline signals.
- Pipeline forecasting: projects revenue from active deal data adjusted for stage and close dates. Only as reliable as your CRM hygiene.
- Opportunity stage forecasting: assigns a close probability to each pipeline stage and calculates a weighted forecast. Useful when stage probabilities reflect actual win rates.
- Bottom-up forecasting: reps commit deals, managers review and adjust, leadership rolls up a number. More visibility than top-down, but skews optimistic without structured deal inspection.
- Multi-variable forecasting: combines CRM activity, pipeline movement, engagement signals, and win rates. The most accurate method, and the most dependent on clean data. Teams with mature processes layer in AI sales forecasting here.
For a full breakdown of each, see Sales forecasting techniques.
Every method breaks down at the same point: Bad data in, bad forecast out. Governance is what keeps the data honest.
How to measure forecast accuracy and why it matters more than optimism
You can’t drive forecast accuracy unless you track it, publish it, and coach to it. That means defining error, spotting bias, and rewarding precision.
Here’s how to do it.
1. Track forecast accuracy with MAPE and WAPE
Start with these two forecasting models:
- MAPE (Mean Absolute Percentage Error): Best for comparing rep-level forecast accuracy.
- WAPE (Weighted Absolute Percentage Error): Better for team-level roll-ups; it adjusts for deal size.
MAPE example (individual rep):
- Rep forecasts $100K, closes $85K
- MAPE = |100−85| ÷ 85 = 17.6% error
WAPE example (team roll-up):
- Team forecasts: $200K, $400K, $300K
- Actuals: $190K, $430K, $280K
- Total absolute error = $60K
- Total actuals = $900K
- WAPE = 60K ÷ 900K = 6.7%
Keep both metrics within a certain accuracy band monthly. That’s your threshold for trust.
2. Monitor forecast bias and coach both directions
Bias tells you if a rep consistently over- or under-commits:
- Positive bias happens when reps over-forecast and miss, often with overconfident hero commits.
- Negative bias is when reps under-forecast and then over-deliver, a pattern better known as sandbagging.
Neither builds trust. Use bias trends to guide 1:1 coaching.
3. Publish forecast accuracy and make it visible
Post forecast accuracy and bias scores by team and role.
Use simple bands (green = accurate, yellow = off, red = way off). Make this part of weekly sales operations reviews and QBRs.
4. Tie accuracy to incentives, even just a little
You don’t need to overhaul comp plans.
Start by tying 5–10% of manager variable comp to forecast accuracy. It creates shared accountability and sends a message that calls matter as much as closes.
How to build a sales forecasting process from scratch
If you're starting from zero or fixing something broken, here's a sequence that works.
Step 1: Define your forecast categories with evidence requirements
Write out what Commit, Best Case, and Upside mean, with probability bands and required proof for each. Get manager sign-off, circulate it to the team, and make it a policy rather than a suggestion.
Commit (≥90%) means near certainty: buyer-confirmed close date, mutual action plan documented, economic buyer engaged, procurement path mapped, and a written risk note. Best Case (60–89%) has traction but unresolved risk, pricing or procurement still open, can't call it at 90%+. Upside (<60%) is pipeline worth tracking, not committing to. Keep it visible in reviews but don't let it prop up the number.
Step 2: Audit and tighten your pipeline stages
Every stage needs clear entry and exit criteria. If reps can advance a deal without meeting specific conditions, your forecast will always be noisy. See Sales pipeline stages for a 9-step framework.
Step 3: Set a locked weekly cadence
Pick 1 roll-up day. Lock the forecast after submission. Any post-lock change of ±5% requires a written reason and manager approval. This single rule does more for accountability than most tools will.
Step 4: Choose your primary forecasting method and direction
For early-stage teams, opportunity stage forecasting is the easiest place to start. For teams with 12+ months of data, layer in historical and multi-variable methods. Most mature teams also run both top-down and bottom-up: top-down to set quotas, bottom-up to test whether the pipeline can actually hit them. When the 2 numbers diverge significantly, that gap is a signal worth investigating. For a full comparison, see Top-down vs. bottom-up forecasting.
Step 5: Instrument accuracy tracking immediately
Start measuring MAPE and WAPE by rep and team. Publish the scores. Without visibility into who's accurate and who isn't, accountability is just a talking point.
Step 6: Run deal inspection, not forecast theater
Replace number-reading calls with structured deal inspection. Pick the 5 most at-risk deals per team and ask for evidence: buyer confirmation, next steps, economic buyer engagement status.
External factors that influence forecast accuracy
Your forecast doesn't live in a CRM bubble. Even a well-governed process gets pushed around by forces outside your control.
A few of the biggest ones:
- Economic conditions like inflation or interest rate shifts that change what buyers can spend.
- Seasonality: fiscal year-end crunches, holiday cycles, and industry-specific demand patterns.
- Competitive moves: a competitor repricing or launching a new feature can swing your win rates fast.
- Regulatory changes: privacy laws, compliance mandates, or geopolitical shifts that push deals out or pull them in.
You can't control any of those. Tightening how reps classify deals and how managers hold the line is what you can actually change. Market swings become inputs to plan around, not reasons to miss.
Forecasting for SMBs vs. enterprise teams
The underlying principles hold regardless of company size. The complexity and tooling requirements don't.
For SMBs, forecasting usually runs through a CRM and a spreadsheet, with 1 or 2 managers owning the roll-up. The biggest risks are inconsistent stage definitions and no audit trail. Get Commit/Best Case categories defined and a weekly lock in place before adding any tooling. See Why SMBs need revenue forecasting for a focused guide.
For mid-market and enterprise teams, the challenges shift to cross-team consistency, territory roll-ups, multi-product pipelines, and manager-level bias. Spreadsheets become a liability at that scale. A dedicated forecasting layer with submission history, approval workflows, and accuracy reporting by segment is worth the investment.
In both cases, governance comes before tooling. No platform fixes a process where "Commit" means something different to every rep on the team.
Forecasting maturity: where does your team sit?
Governance and tools alone won't make a forecast reliable. The culture has to reward accuracy, not optimism.
Most sales orgs fall somewhere on this curve:
Ad hoc. Forecasting is a gut call. Numbers change daily. Finance doesn't trust the number.
Repeatable. Categories exist, and a cadence is set, but enforcement is inconsistent, and accuracy isn't tracked.
Managed. Stage exits are enforced, accuracy is measured, and bias is surfaced and addressed through coaching.
Optimized. AI flags deal risk, submission history drives coaching, and forecast accuracy is a team-level KPI tied to comp.
Most teams overestimate where they are. If you can't answer "what was our MAPE last quarter by rep?" you're probably at repeatable, not managed.
For guidance on moving up, see "Building a culture of revenue forecasting."
Where AI and revenue intelligence help with forecasting
AI-powered analytics don’t replace forecast judgment; they strengthen it. What AI-powered sales forecasting and revenue intelligence add is signal: evidence you can’t always surface in CRM reports or rep notes. Used right, they tighten the loop between what’s committed and what’s actually real.
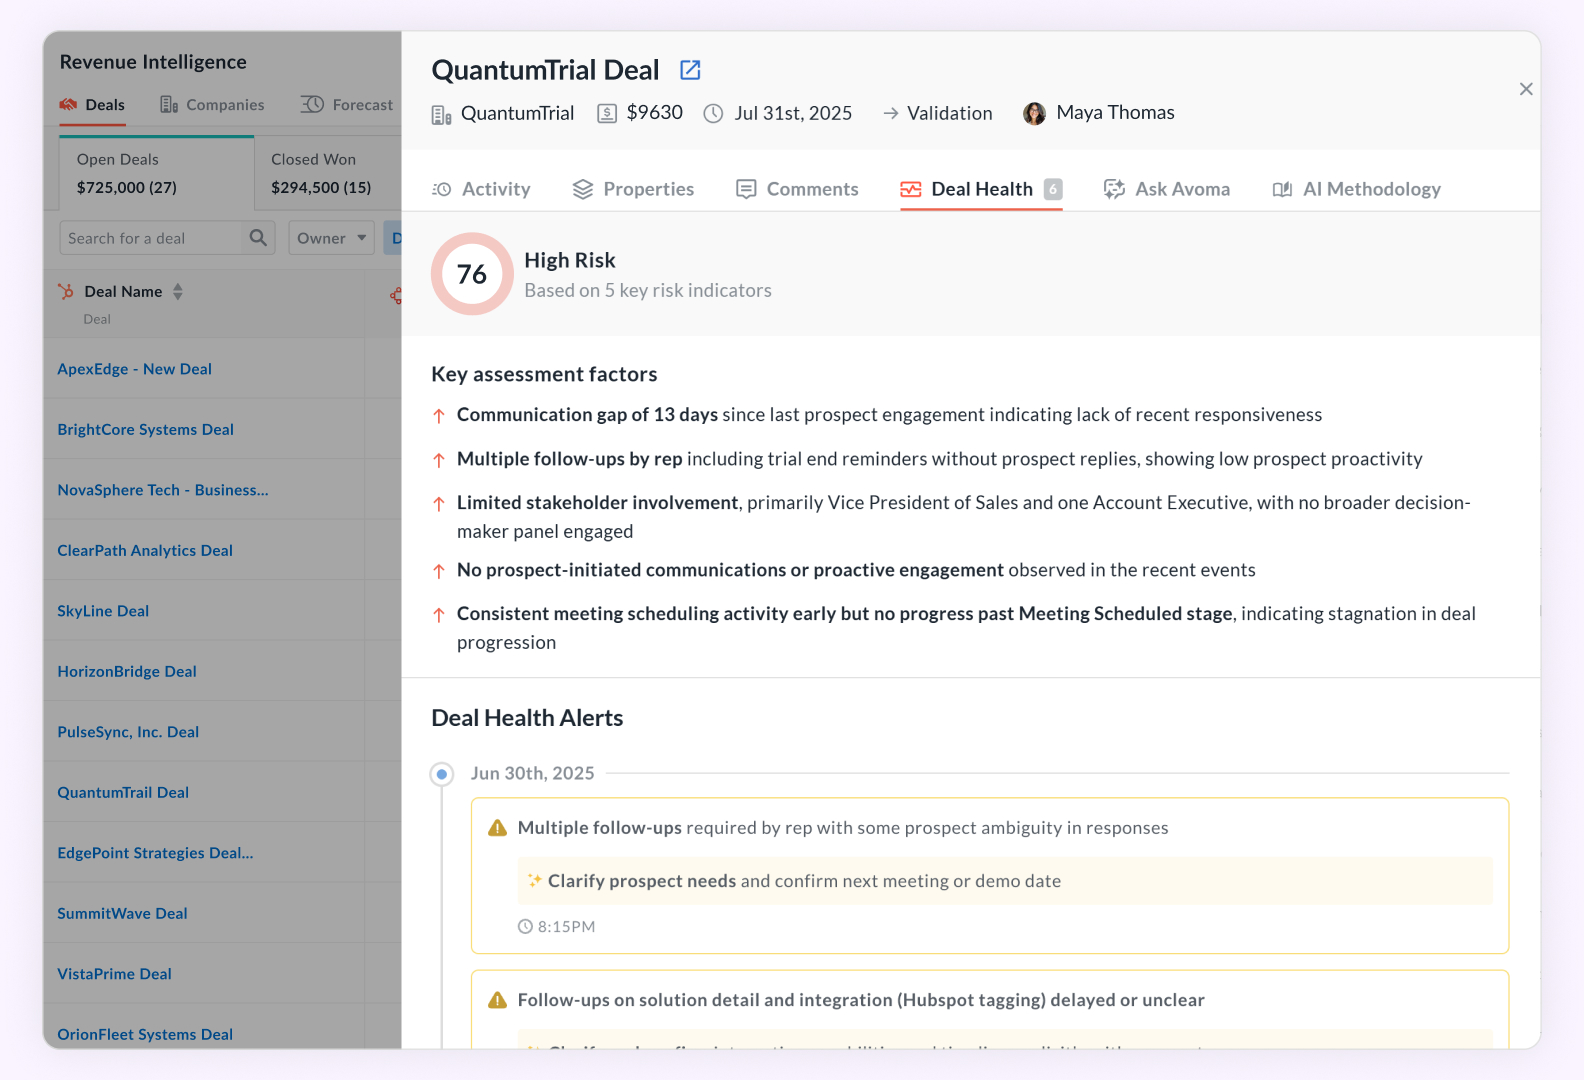
1. Highlights risks using deal intelligence
AI reviews calls, emails, and meeting notes to check if next steps are real or just wishful thinking. Deal intelligence tool surfaces missing decision-makers, stalled opportunities, and unaddressed risks to make forecasts sharper and faster.
2. Forecast workflow with submission history
Revenue intelligence platform logs every forecast submission and change. That means you can see trends: a rep who always adds 20% in the last week, or a manager who consistently lowers Commit at roll-up. This history is critical for coaching bias and driving accountability.
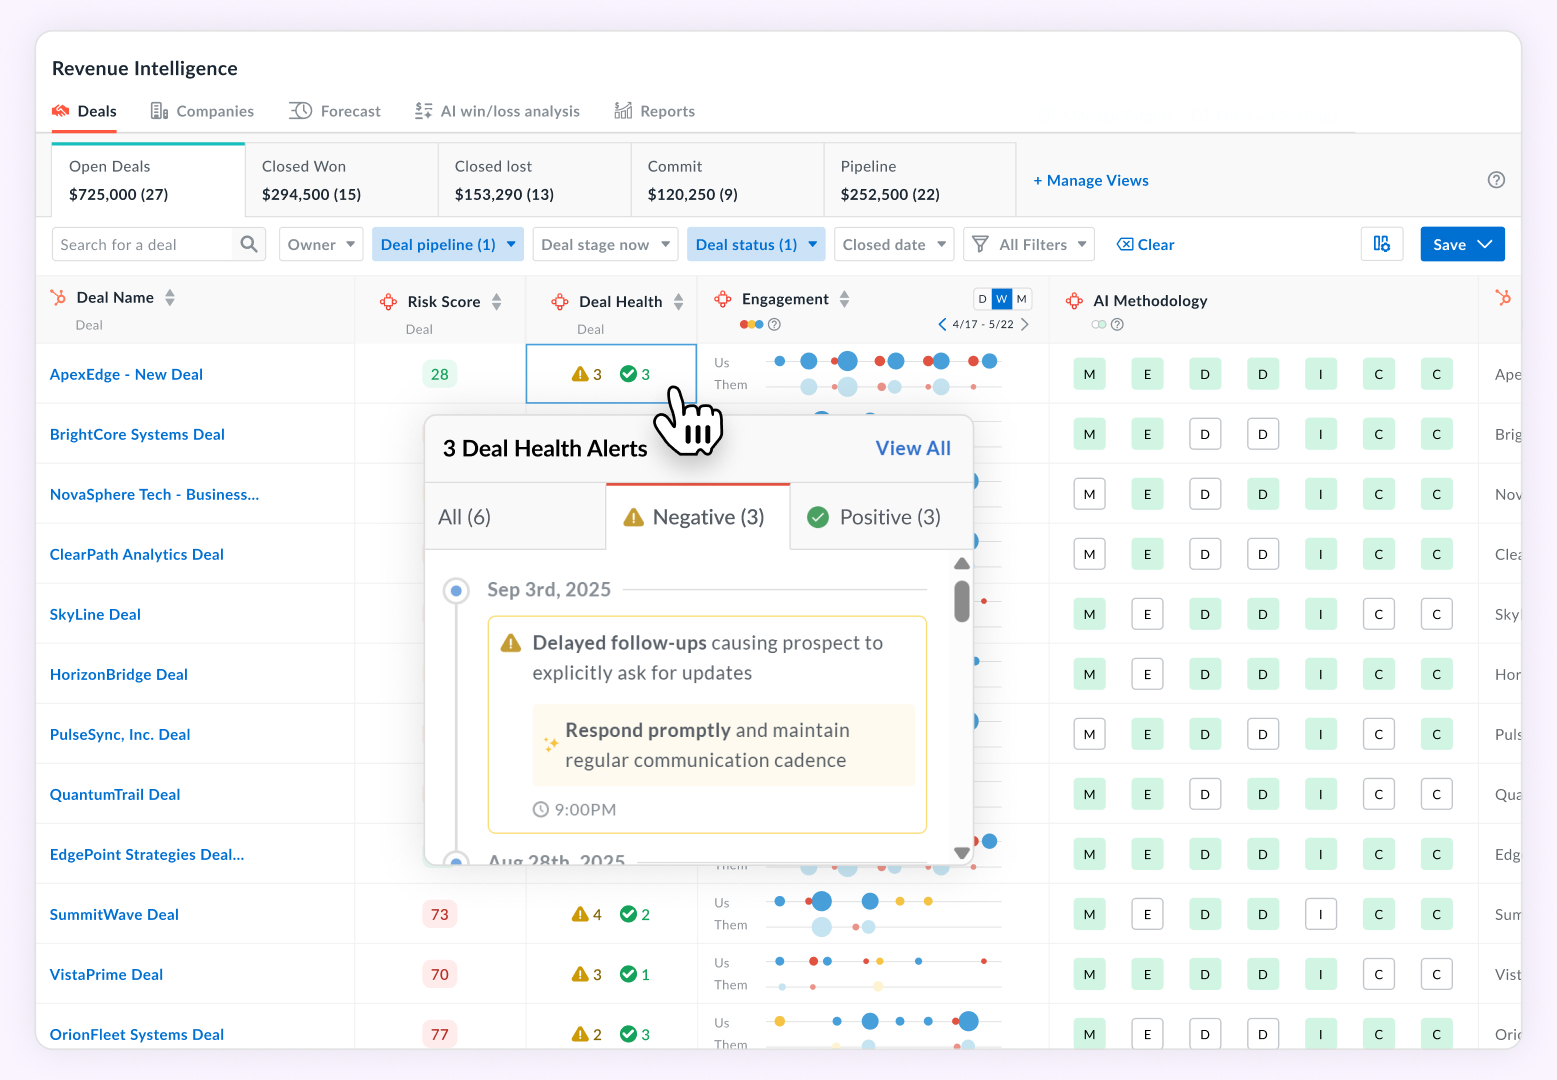
3. Pipeline health monitoring
Pipeline management software surfaces risks your spreadsheet won’t: stage thrash, deals that shrink after "verbal commit," or pipeline sitting untouched for 30+ days. Instead of reactive end-of-quarter scrambling, you get proactive alerts that protect forecast accuracy.
4. CRM hygiene and evidence capture
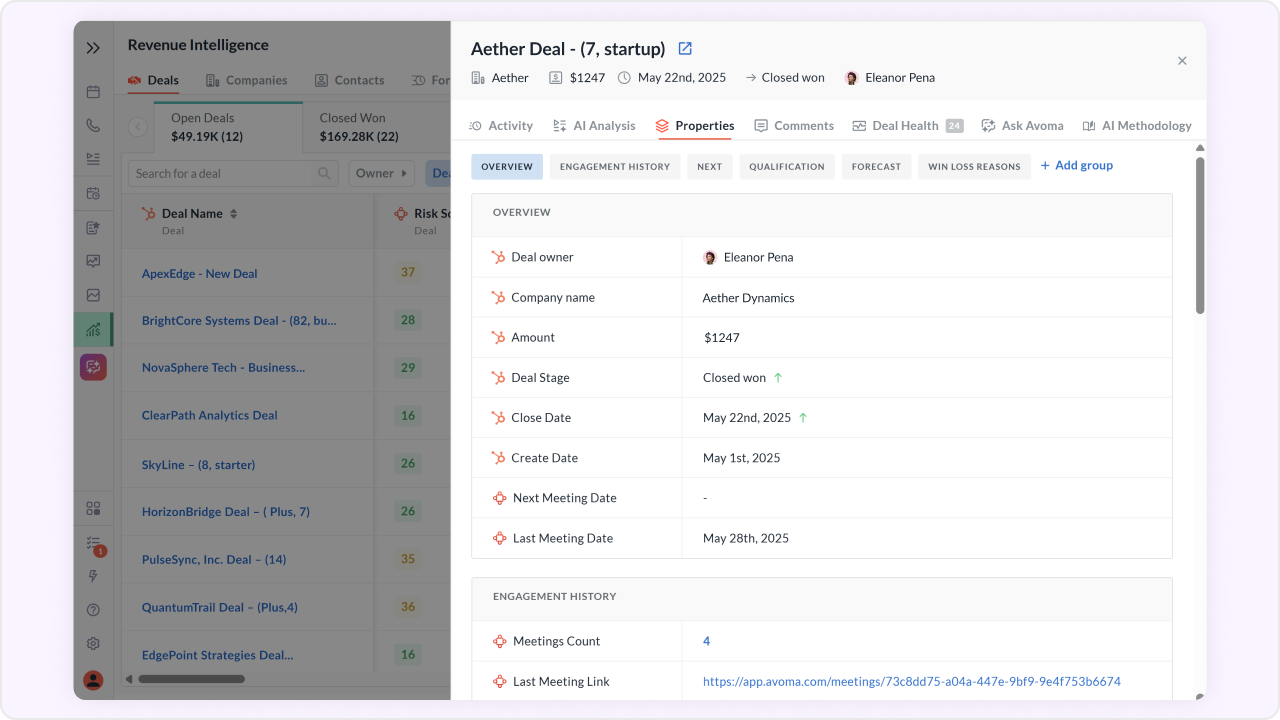
Customer relationship management tools and revenue intelligence platforms automatically sync notes, emails, and activity data back to your CRM. That means when a rep marks Commit, you have the receipts like buyer confirmation, mutual plan, stakeholder coverage right in the system.
5. Deal risk across Commit, Best Case, and Upside
AI highlights risk at any stage of the forecast. By analyzing conversation intelligence and buyer engagement, it flags when deals lack momentum: a Commit deal without an executive sponsor should be Best Case, while a Best Case deal with silent buyers belongs in Upside. Managers can reclassify deals based on evidence, not instinct, keeping the forecast clean and giving Finance fewer last-minute surprises.
6. Coaching to keep deals moving
Once deals are classified and the forecast is set, managers can use AI-powered analytics and conversation intelligence to coach reps in real time. By spotting stalled opportunities, surfacing missing next steps, or highlighting weak buyer engagement, they can keep deals progressing and prevent pipeline drift.
What to look for in a sales forecasting tool
Spreadsheets work until they don't. Past about 10 reps, the manual updates, missing audit trails, and lack of deal visibility start costing you.
Here's what matters when you're evaluating tools:
- Forecast category management: Commit, Best Case, Most Likely, and Upside with rep-level submission and manager override
- Submission history and change tracking: who changed what and when, non-negotiable for accountability
- Pipeline health signals: proactive flagging of stalled deals, stage thrash, and coverage gaps
- CRM integration: live deal data, not manual sync
- AI deal risk scoring: flags based on conversation signals, not just CRM field values
- Accuracy reporting: MAPE, WAPE, and bias by rep and team, built in
For a full breakdown, see Sales forecasting tools.
How Avoma operationalizes sales forecasting
A governance-first sales forecasting process can be run in spreadsheets and CRM applications, but Avoma’s revenue intelligence platform makes it easier to operationalize.
Here’s how it helps:
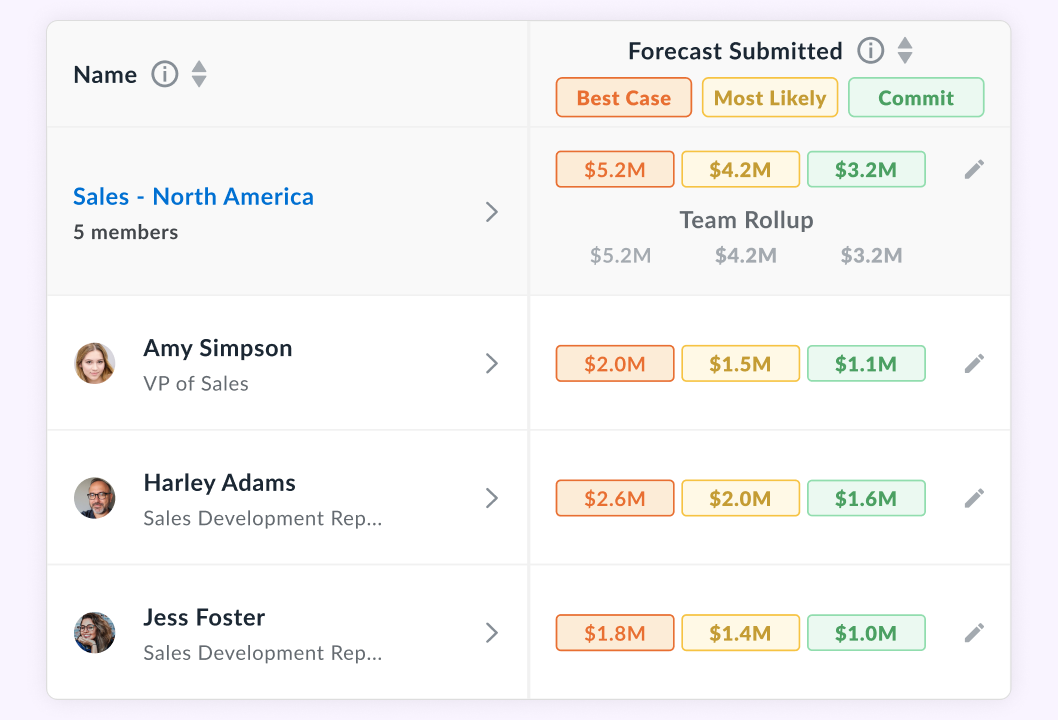
1. Forecast board with Pipeline, Best Case, Commit, and Closed Won categories that roll up by rep and manager.
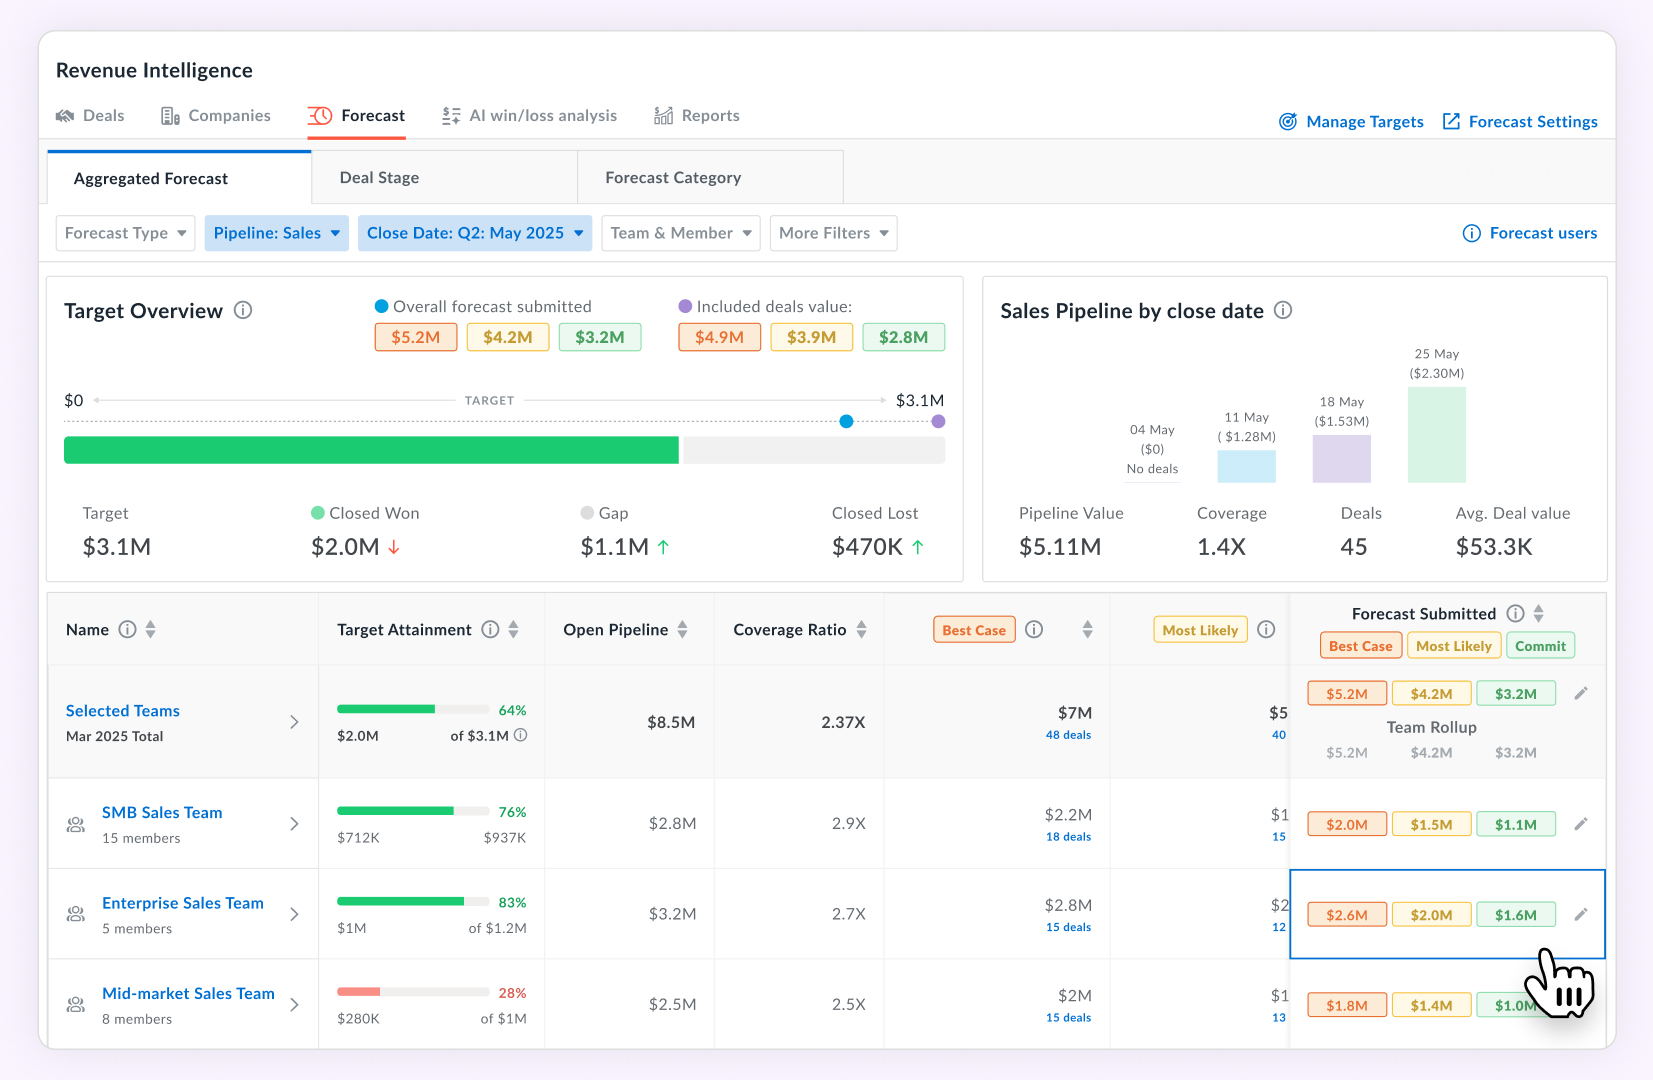
2. Submission views showing aggregate forecast categories (Best Case, Most Likely, Commit) alongside total deal value, so leaders can compare what’s submitted vs. what’s in pipeline.
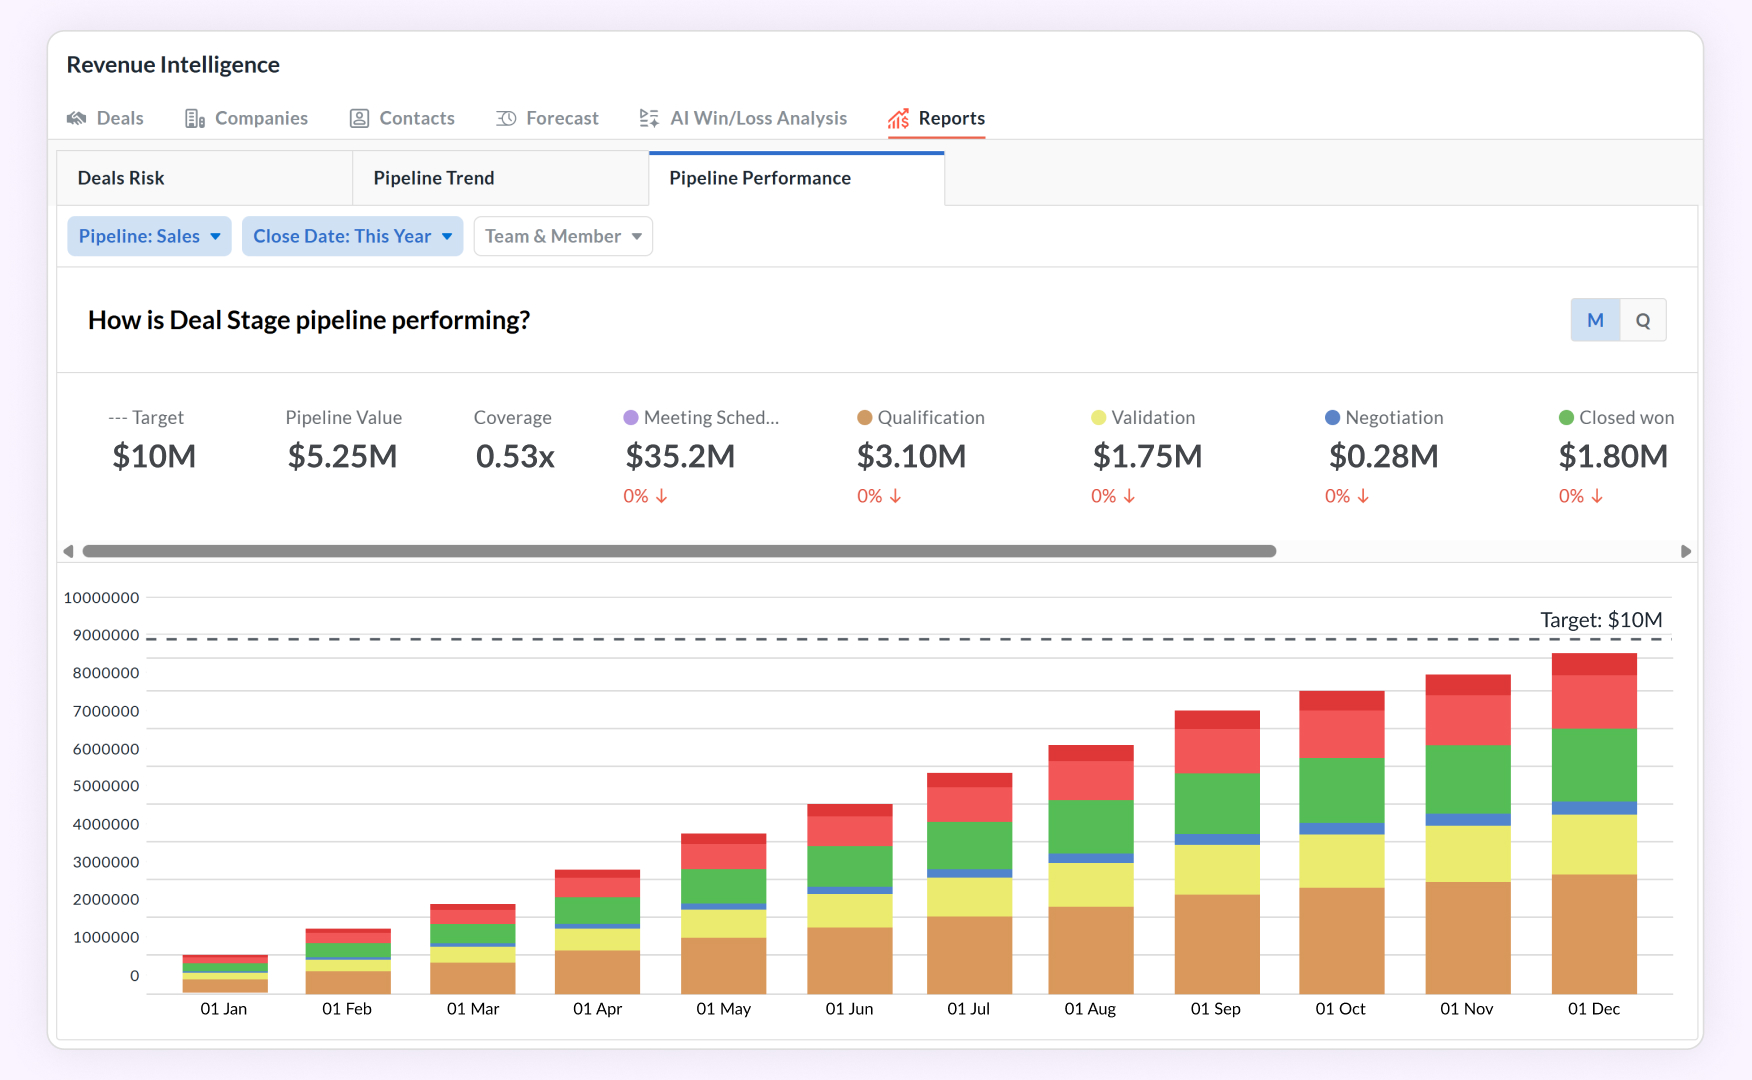
3. Pipeline by close date with visibility into deal size, counts, values, and stage distribution. This makes it easier to see where pipeline gaps exist.
4. Roll-up of team submissions with drill-down detail into selected deals, so managers can validate Commit with actual deal evidence.
5. CRM sync that ties activity, buyer confirmation, and mutual close plans directly to the opportunity record.
You can find setup guides in the Avoma help docs: guide to the forecast tool, forecast settings, forecast submission and history, managing forecast targets, and enabling Slack alerts for deal risk.
If your team is ready to move off spreadsheets and give Finance a number it can actually plan around, start with Avoma's revenue intelligence platform. And if forecast accuracy is the specific problem you're trying to solve, the sales forecast accuracy page walks through how Avoma approaches it end-to-end.
Final word
Forecast accuracy doesn’t come from more formulas. It comes from governance, evidence, and accountability. Stage exits, Commit rules, accuracy KPIs, and a weekly cadence build the foundation.
AI-powered sales forecasting and revenue intelligence strengthen it by validating what’s real and keeping deals moving. Get those pieces in place, and your forecast becomes a number Finance can trust.
Revenue intelligence tools like Avoma make this easier. With forecast boards, pipeline visibility, and conversation intelligence built in, Avoma helps sales leaders and RevOps teams operationalize a governance-first sales forecasting process without relying on spreadsheets alone. Book a demo of Avoma to see it in action.
Frequently Asked Questions
Avoma aggregates forecasts based on forecast categories (such as best case, commit, and most likely), rolling up individual rep submissions into team and company-level views. The roll-up can be customized to match your process.
Yes, reps can submit and update their own forecasts, and managers can override or edit submissions as needed. Changes are tracked for transparency.
Yes, you can set targets for each rep or team, and track progress against those goals within Avoma.
Yes, Avoma allows you to customize which fields are imported and used for forecasting, including mapping custom fields from your CRM.
Avoma supports monthly, quarterly, and yearly forecasting cadences; you can select the cadence that fits your business.
Avoma provides deal health insights, risk alerts, and coaching recommendations to help managers and reps identify at-risk deals and improve the reliability of their forecasts.


Dive into Our Latest
Avoma Insights.


What's stopping you from turning every conversation into actionable insights?


